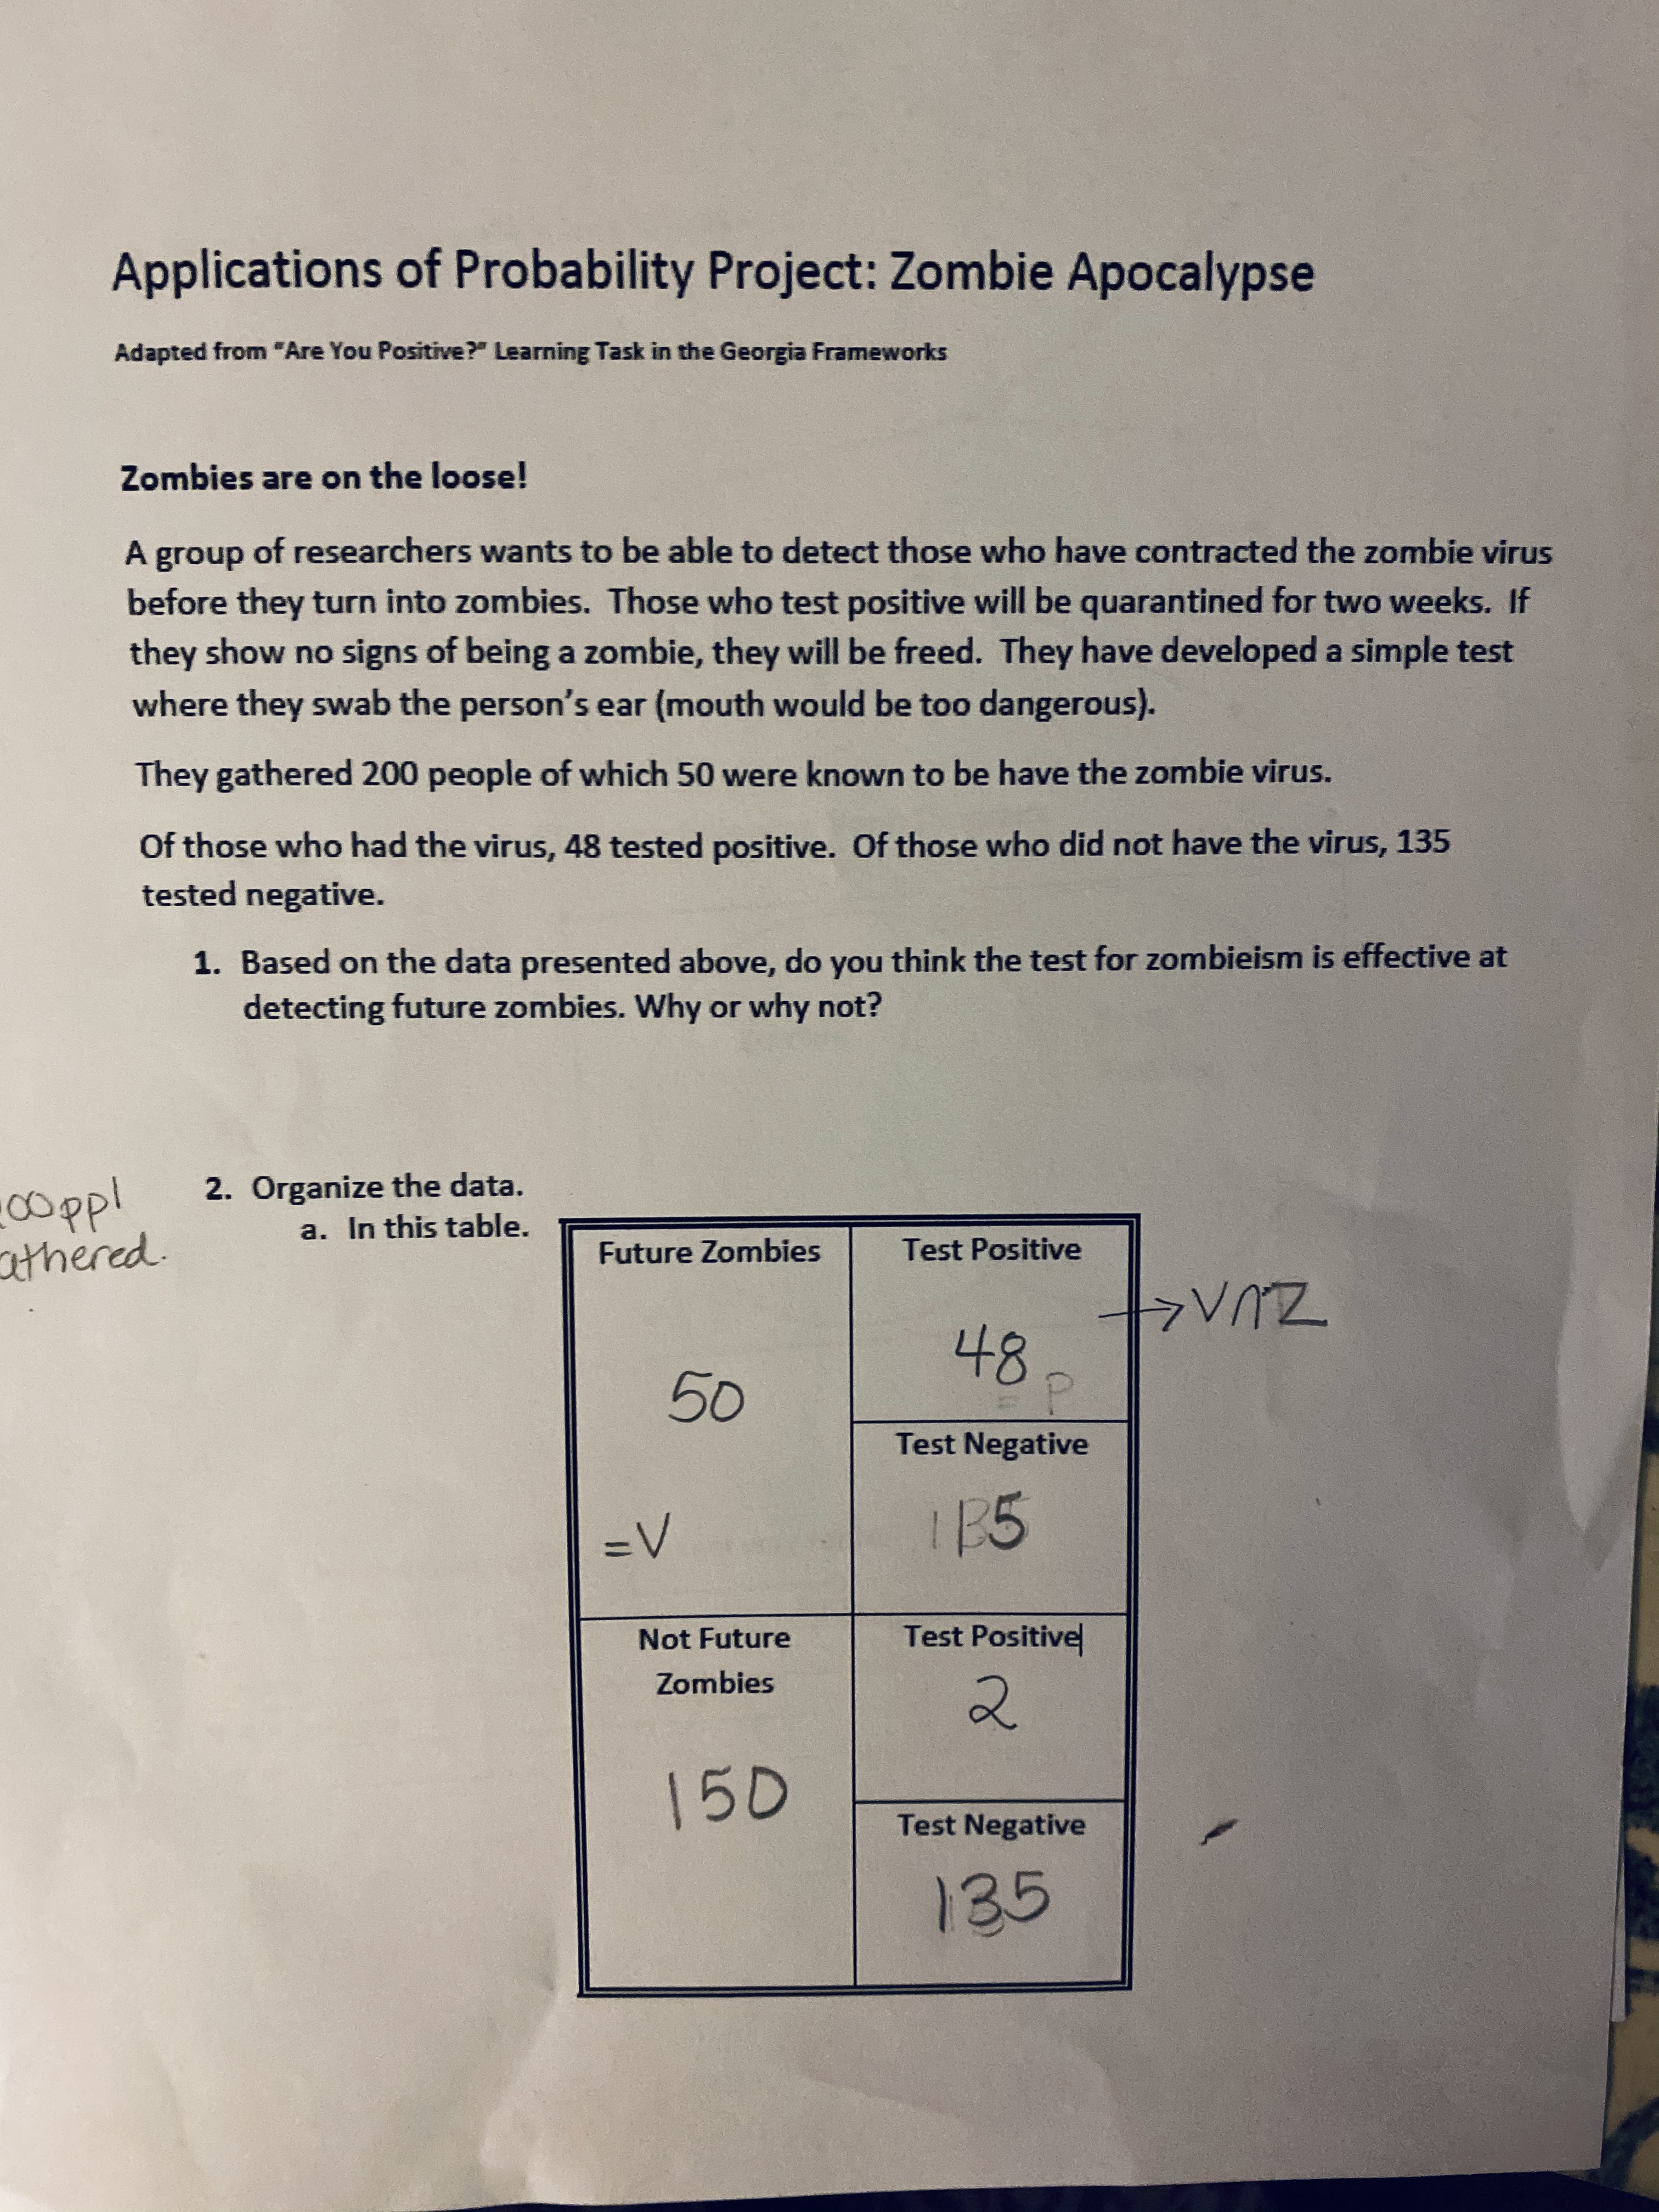
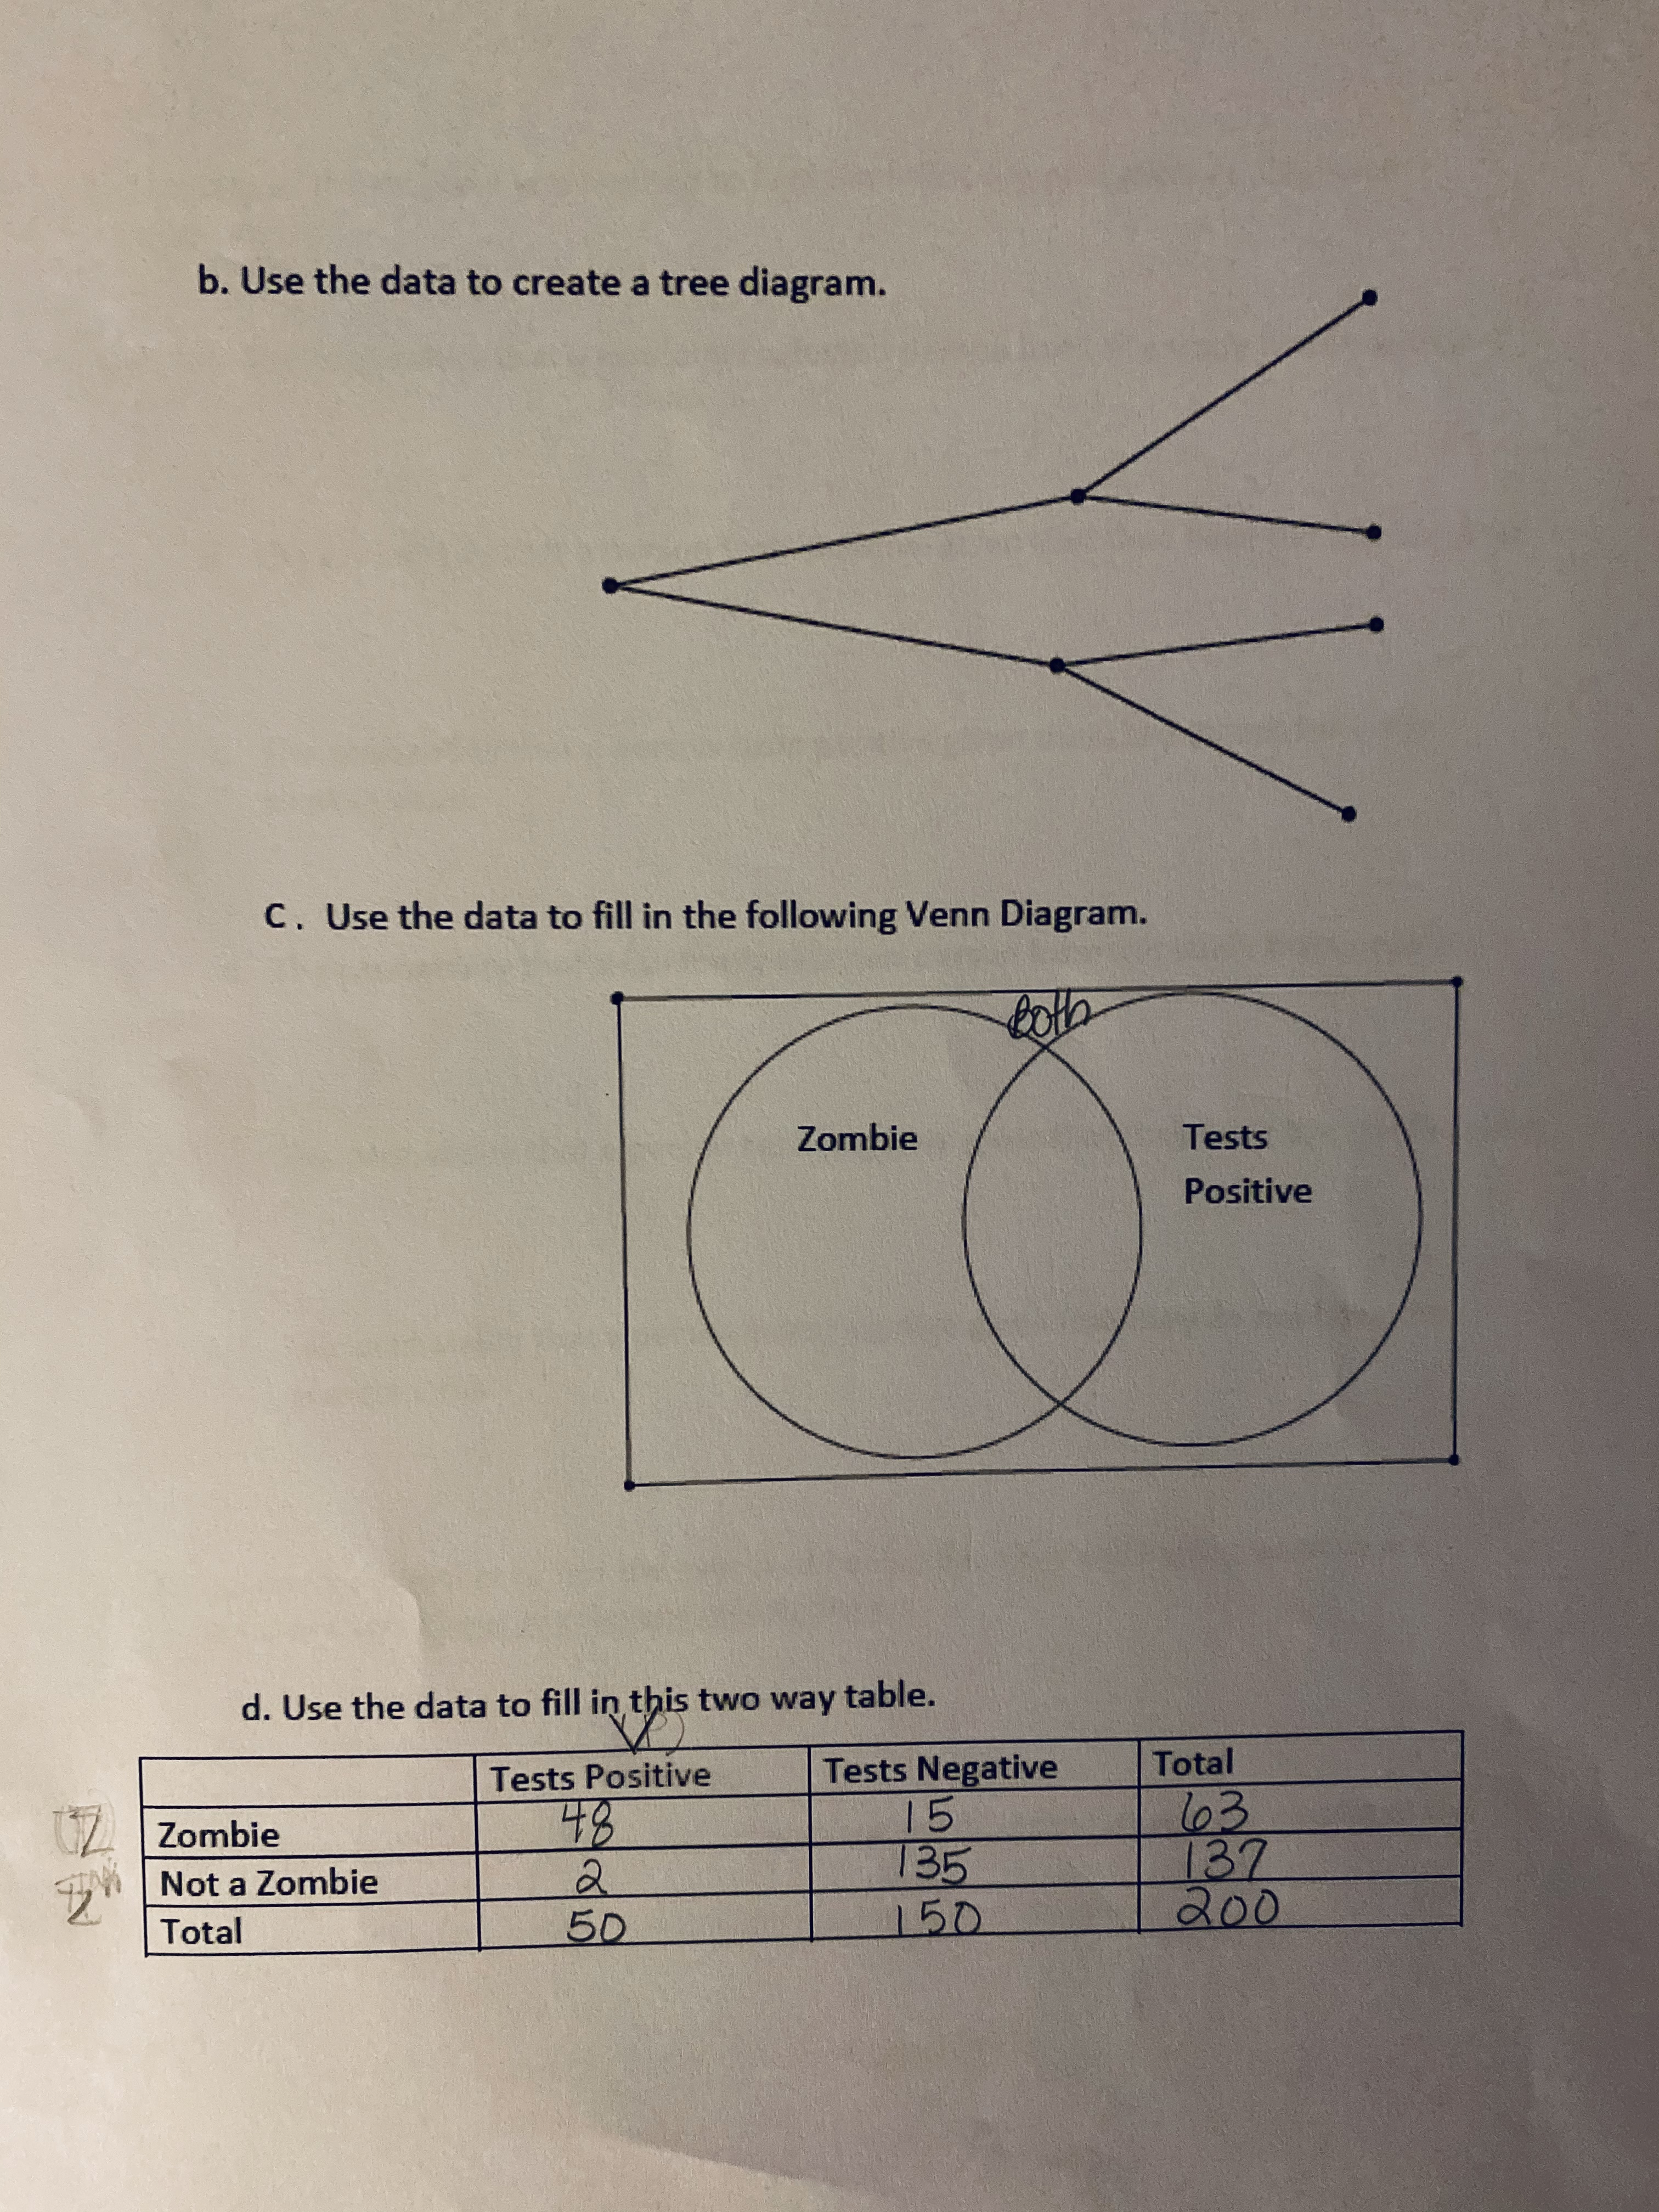
Can you help me solve the last page to the Geometry Applications of Probability:Zombie Apocalypse project? I'm looking for help on solving the probabilities after organizing the data. I have solved the data table. I will attach both. I need help with solving the last page of this project. Thank you!
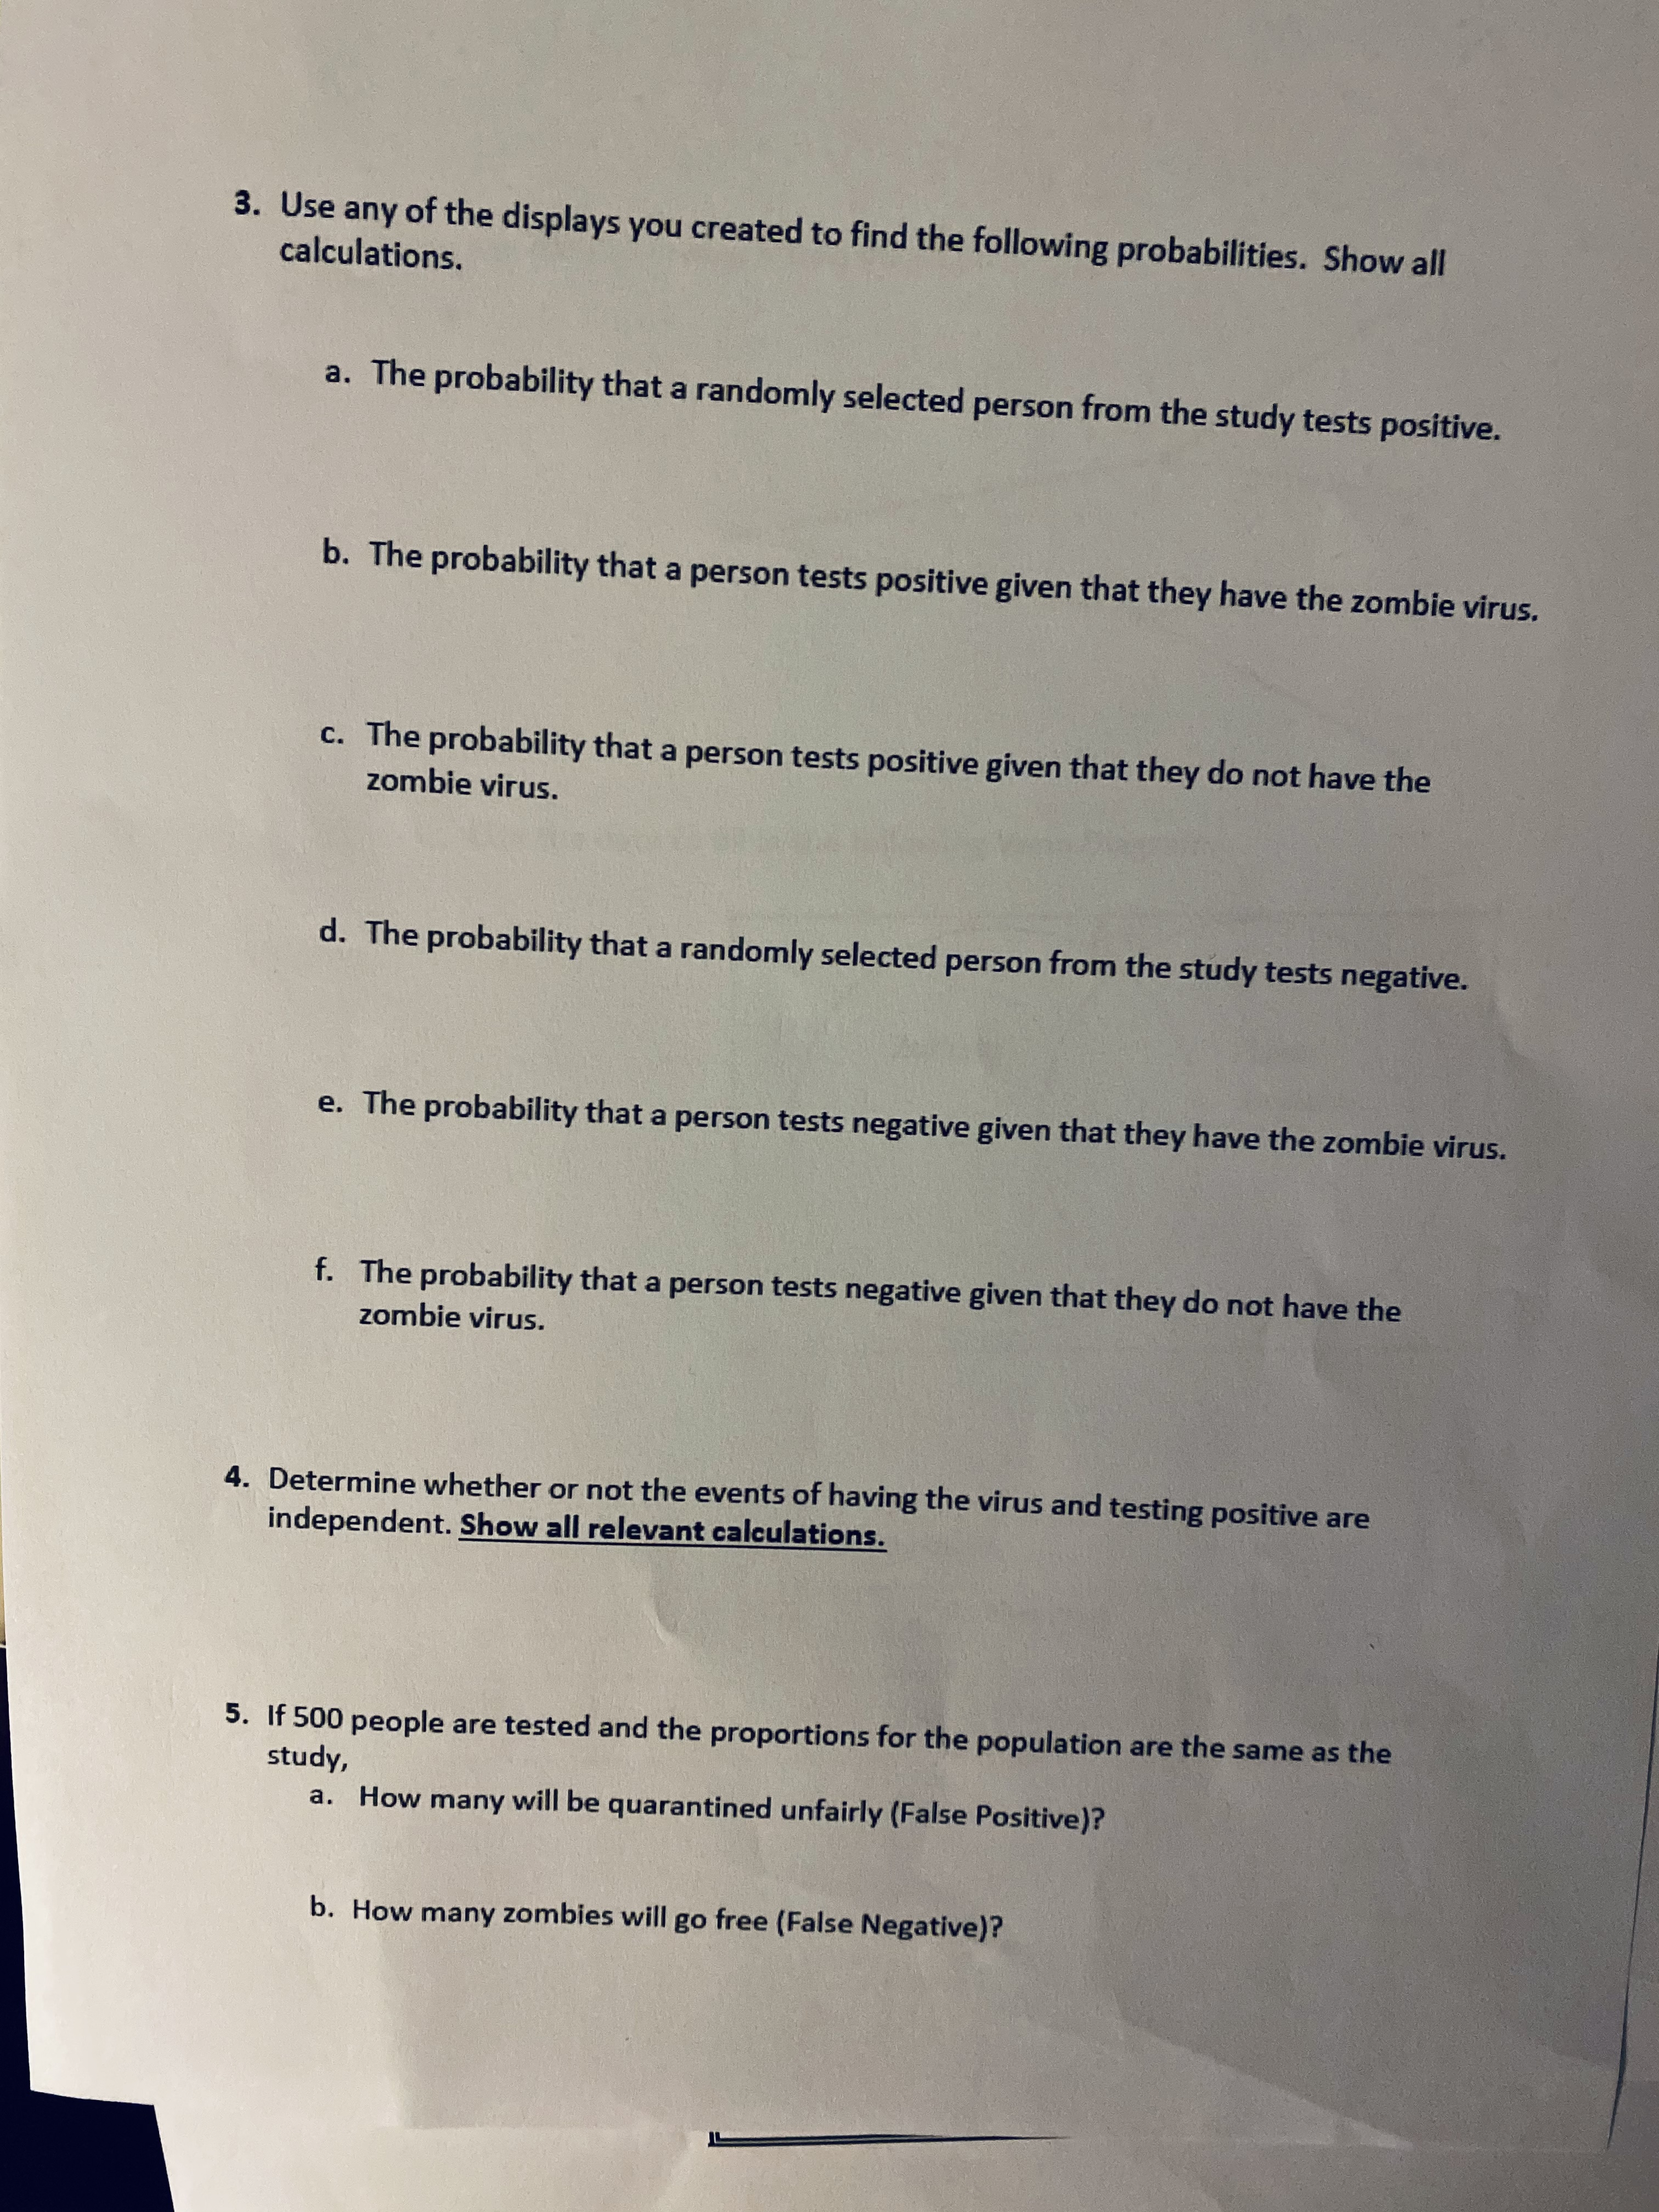
3. Use any of the displays you created to find the following probabilities. Show all calculations. a. The probability that a randomly selected person from the study tests positive. b. The probability that a person tests positive given that they have the zombie virus. c. The probability that a person tests positive given that they do not have the zombie virus. d. The probability that a randomly selected person from the study tests negative. e. The probability that a person tests negative given that they have the zombie virus. f. The probability that a person tests negative given that they do not have the zombie virus. 4. Determine whether or not the events of having the virus and testing positive are independent. Show all relevant calculations. 5. If 500 people are tested and the proportions for the population are the same as the study, a. How many will be quarantined unfairly (False Positive)? b. How many zombies will go free (False Negative)?Applications of Probability Project: Zombie Apocalypse Adapted from "Are You Positive?" Learning Task in the Georgia Frameworks Zombies are on the loose! A group of researchers wants to be able to detect those who have contracted the zombie virus before they turn into zombies. Those who test positive will be quarantined for two weeks. If they show no signs of being a zombie, they will be freed. They have developed a simple test where they swab the person's ear (mouth would be too dangerous). They gathered 200 people of which 50 were known to be have the zombie virus. Of those who had the virus, 48 tested positive. Of those who did not have the virus, 135 tested negative. 1. Based on the data presented above, do you think the test for zombieism is effective at detecting future zombies. Why or why not? copp! 2. Organize the data. a. In this table. athered. Future Zombies Test Positive 48 50 Test Negative =V 15 Not Future Test Positive Zombies 2 150 Test Negative 1:35b. Use the data to create a tree diagram. C. Use the data to fill in the following Venn Diagram. Zombie Tests Positive d. Use the data to fill in this two way table. Tests Positive Tests Negative Total Zombie 48 15 63 Not a Zombie 2 135 137 Total 50 150 200