can you help me solve these question. its all combined 1 question. thank you
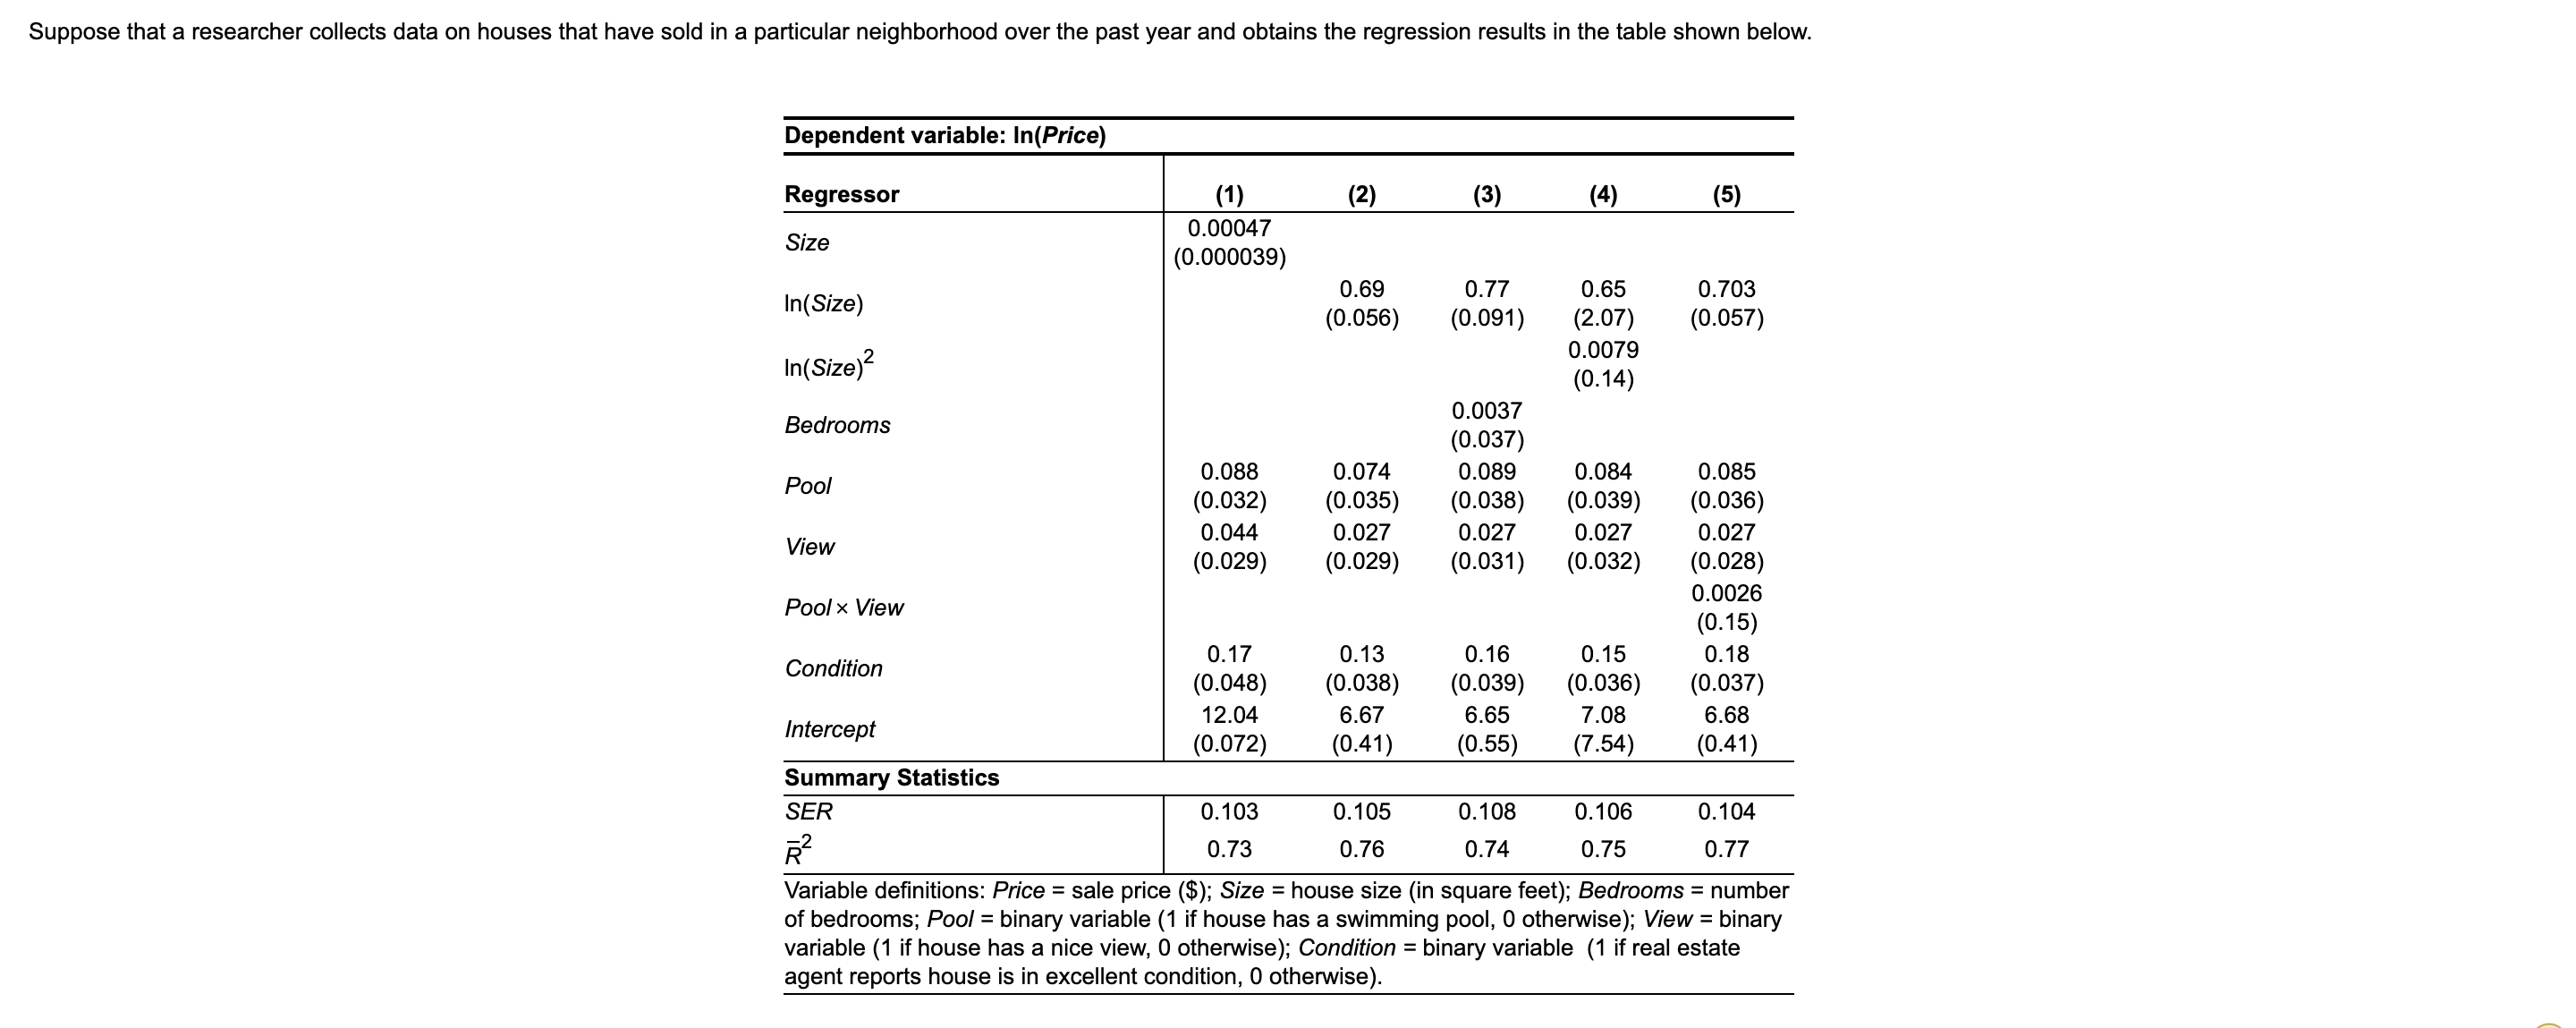
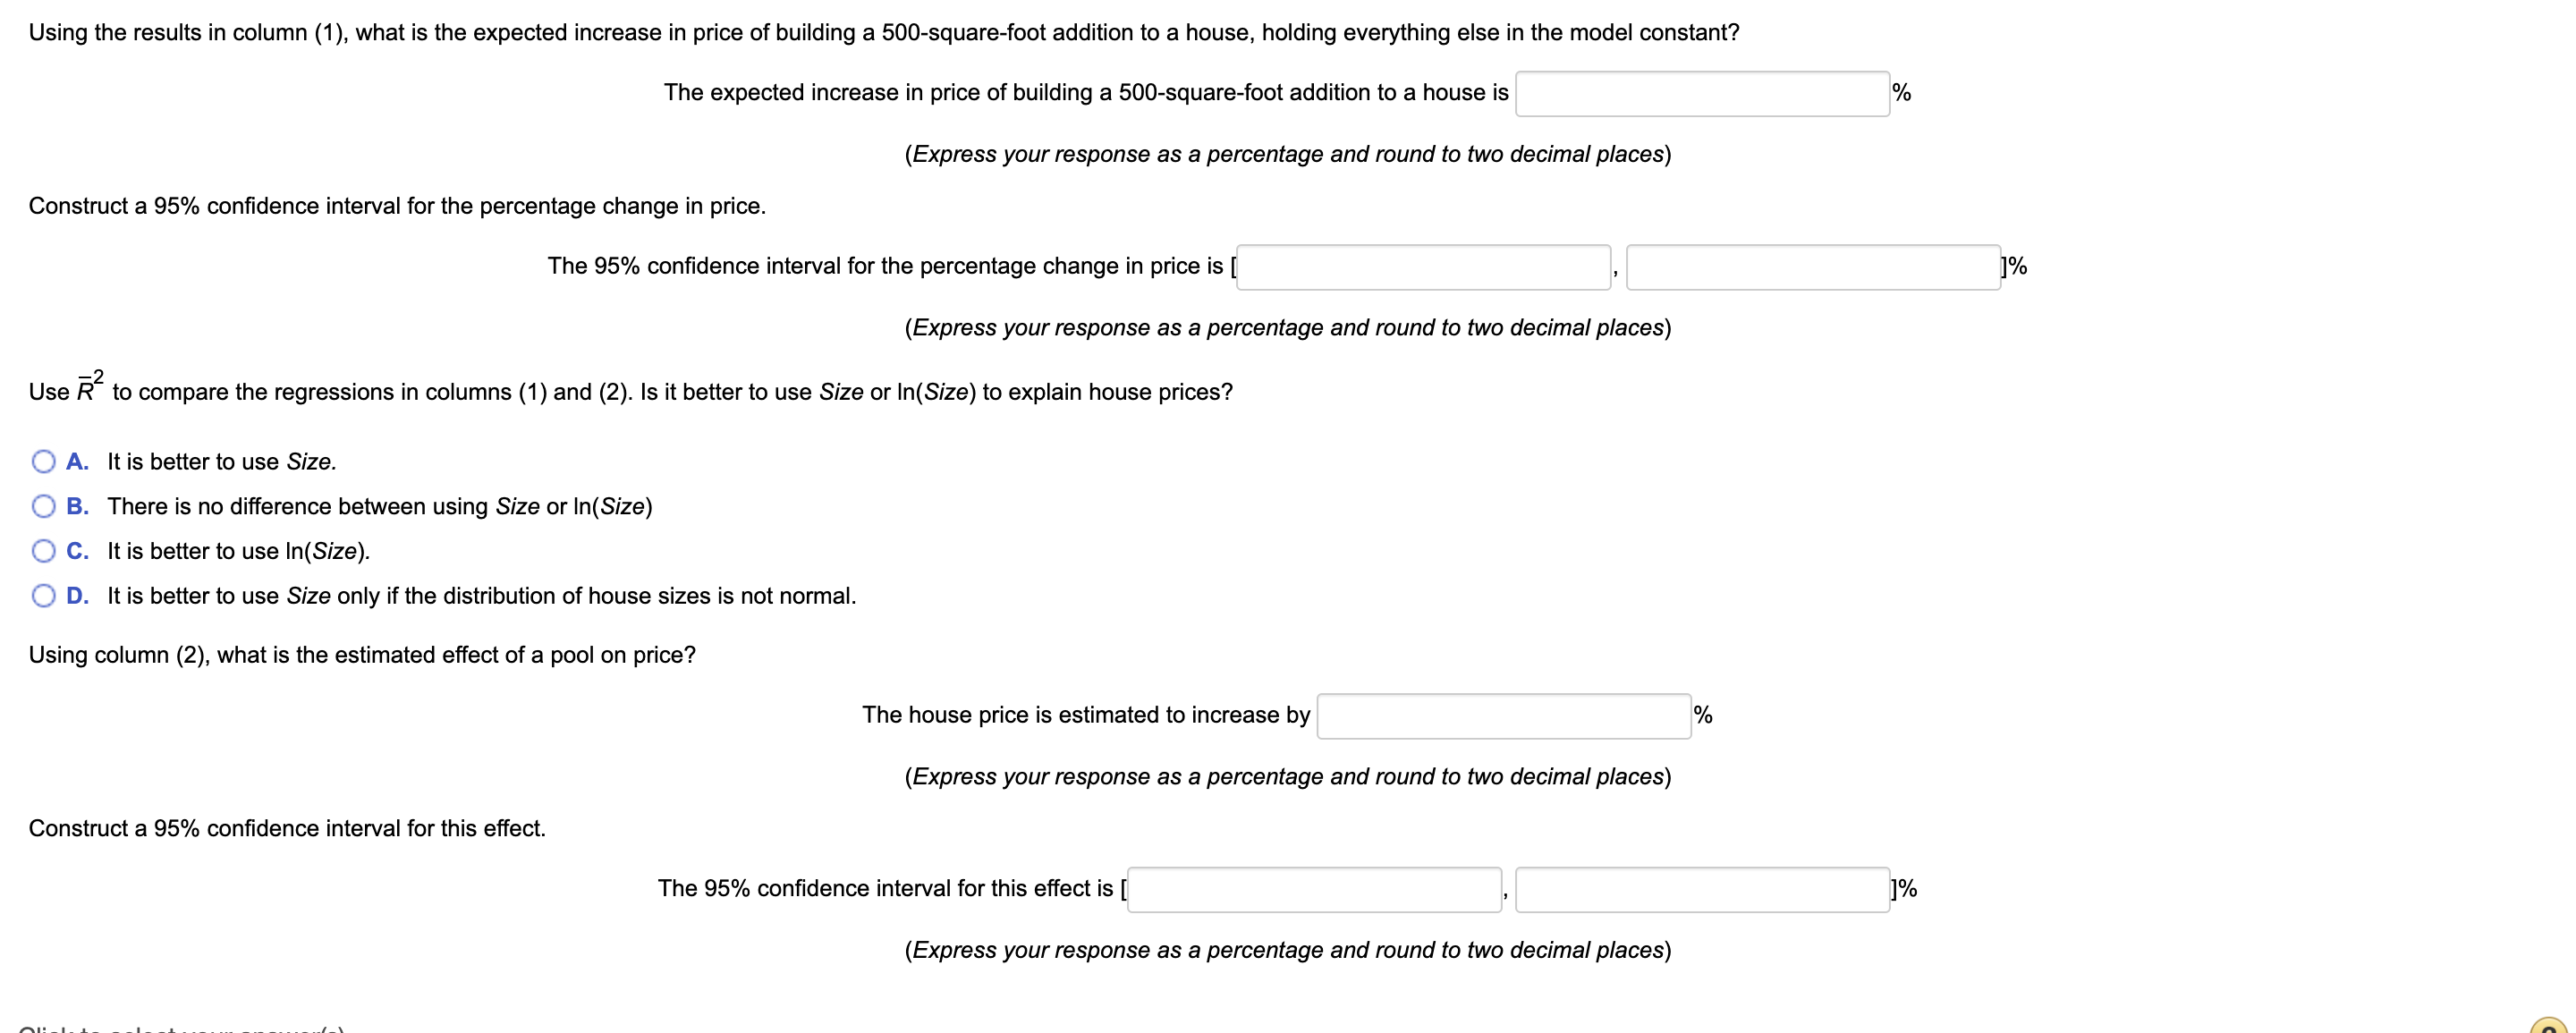
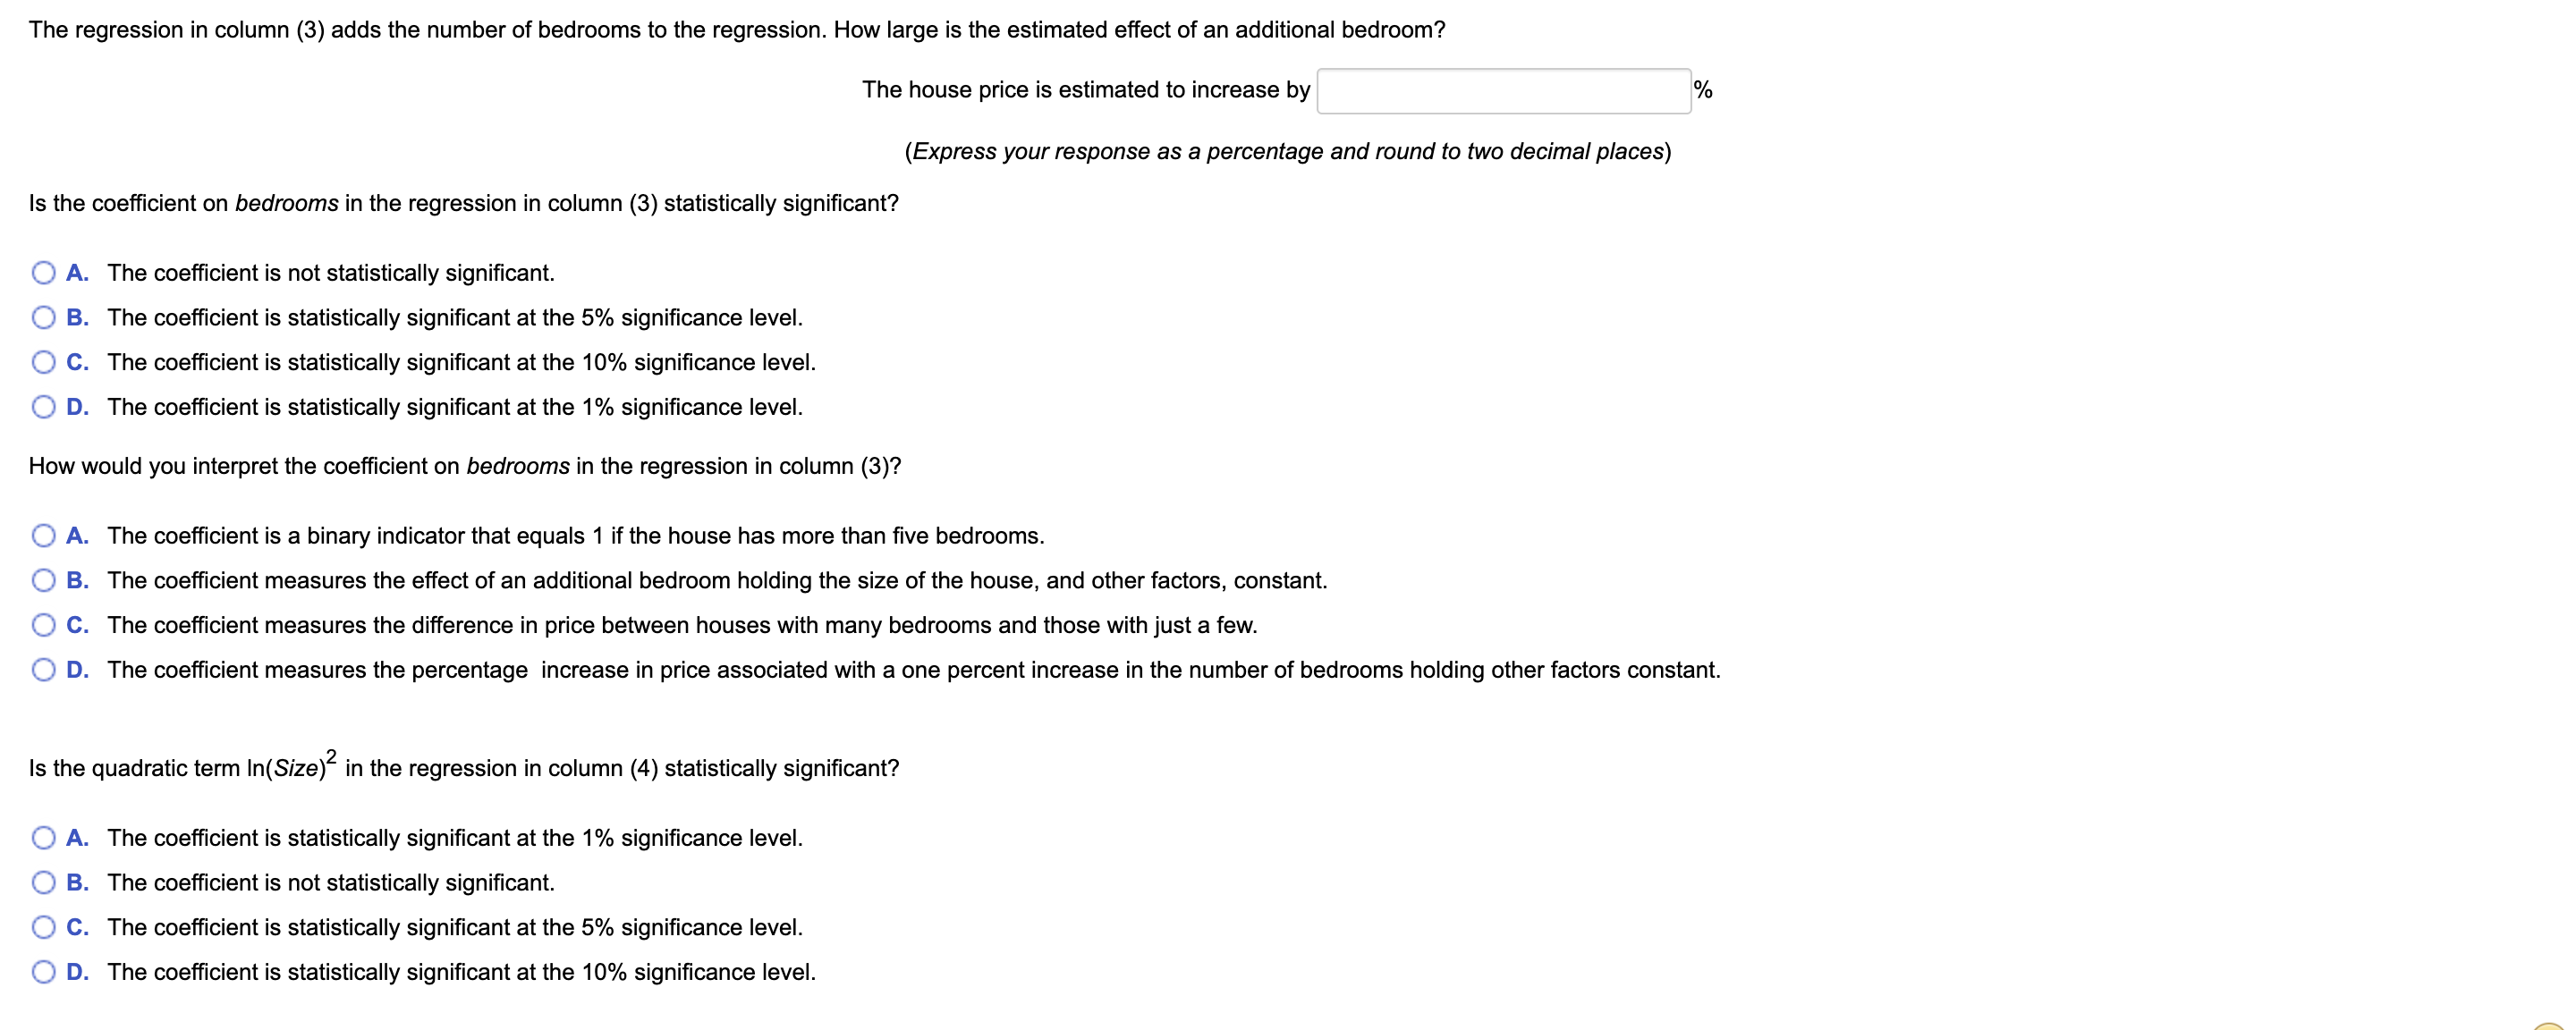
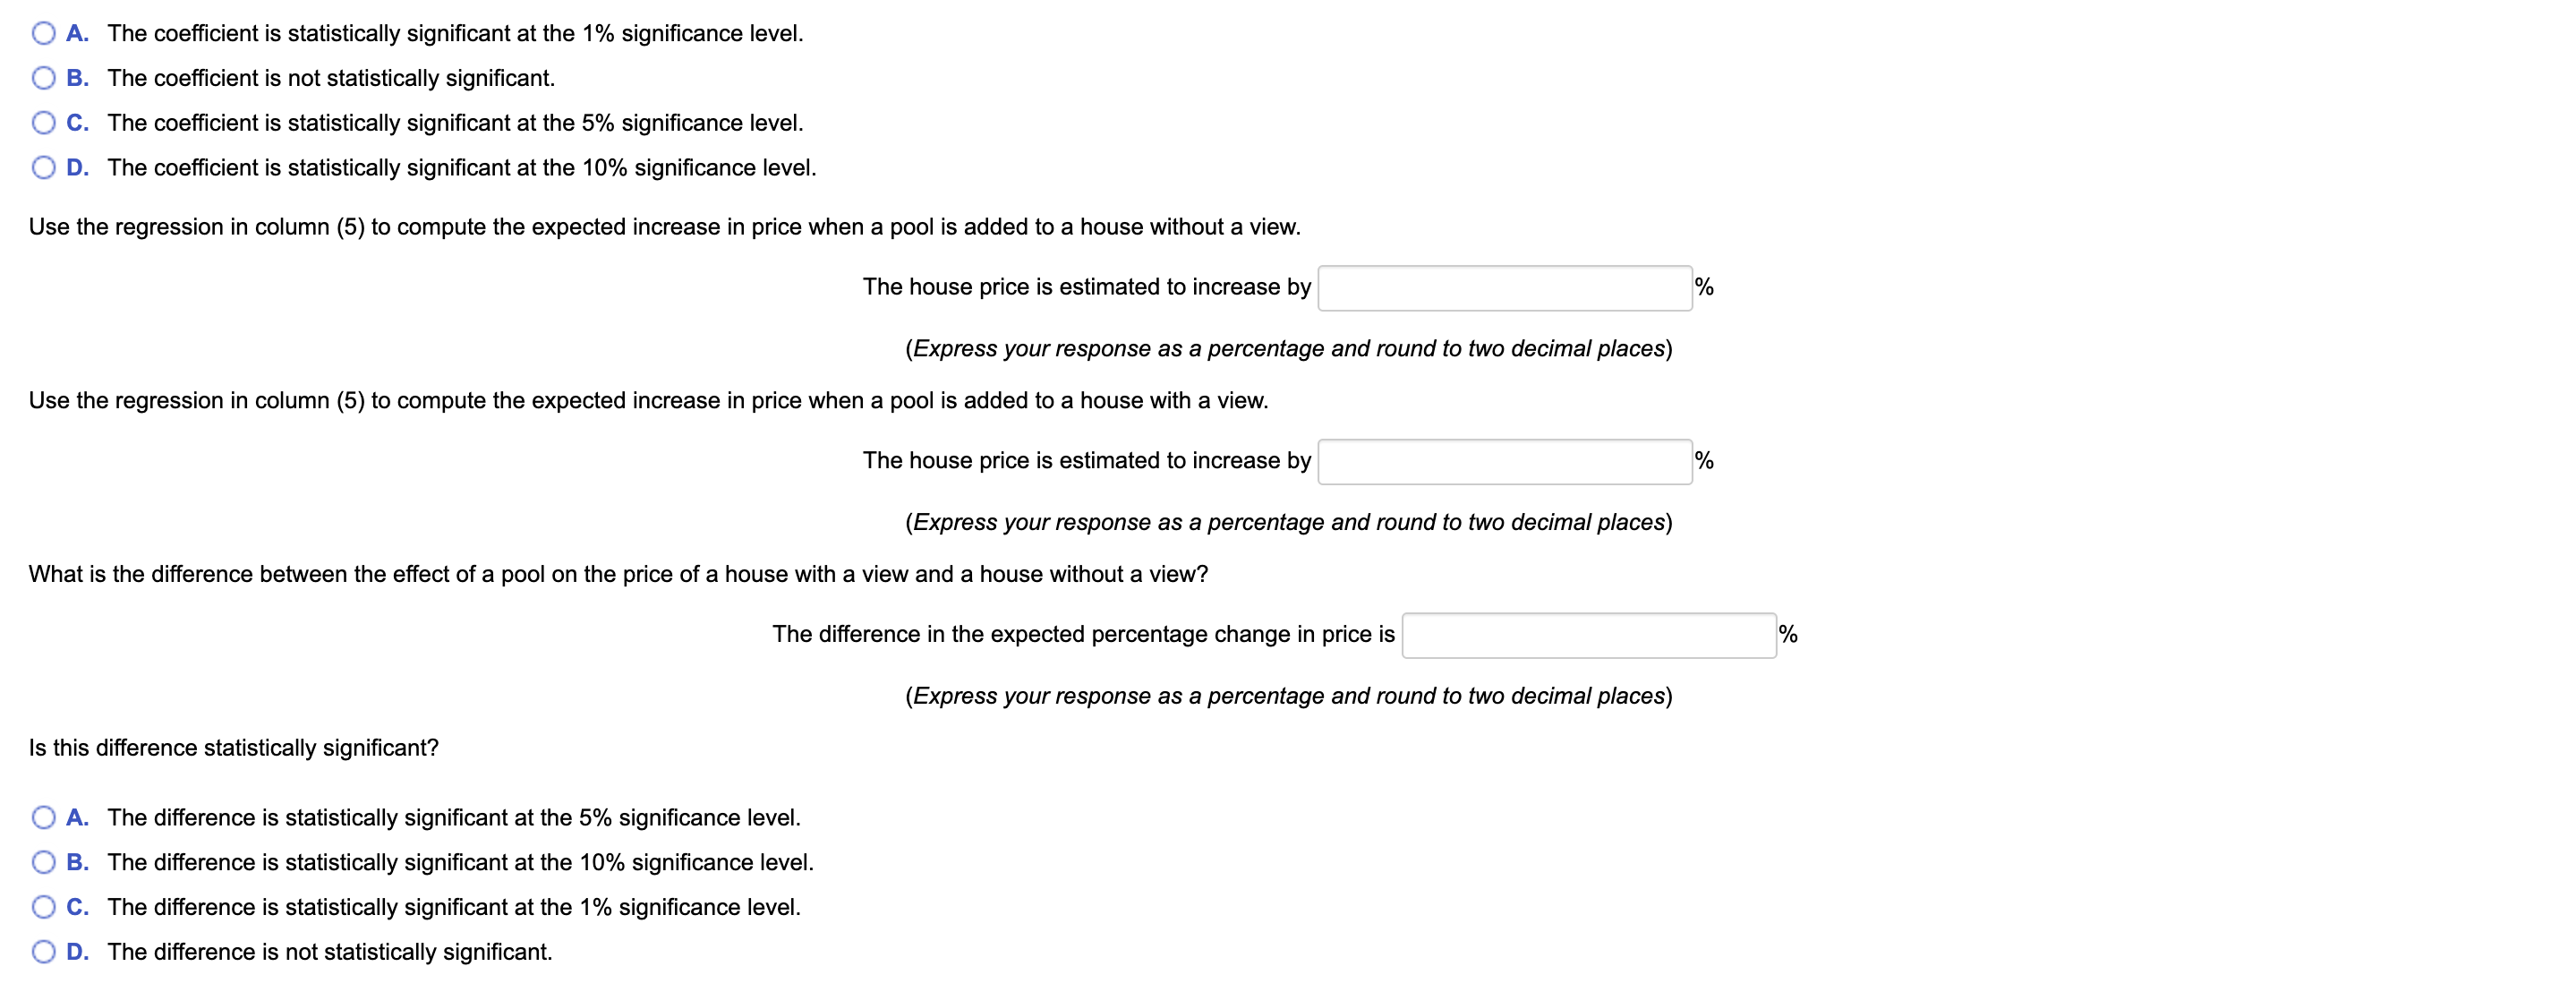
Suppose that a researcher collects data on houses that have sold in a particular neighborhood over the past year and obtains the regression results in the table shown below. Dependent variable: In(Price) Regressor 1) (2 ) (3) (4) (5) Size 0.00047 (0.000039) In(Size) 0.69 0.77 0.65 0.703 (0.056) (0.091) (2.07) (0.057) In(Size)2 0.0079 (0.14) Bedrooms 0.0037 (0.037) Pool 0.088 0.074 0.089 0.084 0.085 (0.032) (0.035) (0.038) (0.039) (0.036) View 0.044 0.027 0.027 0.027 0.027 (0.029) (0.029) (0.031) (0.032) (0.028) Pool x View 0.0026 (0.15) Condition 0.17 0.13 0.16 0.15 0.18 (0.048) (0.038) (0.039) (0.036) (0.037) Intercept 12.04 6.67 6.65 7.08 6.68 (0.072) (0.41) (0.55) (7.54) (0.41) Summary Statistics SER 0.103 0.105 0.108 0. 106 0. 104 0.73 0.76 0.74 0.75 0.77 Variable definitions: Price = sale price ($); Size = house size (in square feet); Bedrooms = number of bedrooms; Pool = binary variable (1 if house has a swimming pool, 0 otherwise); View = binary variable (1 if house has a nice view, 0 otherwise); Condition = binary variable (1 if real estate agent reports house is in excellent condition, 0 otherwise).Using the results in column (1), what is the expected increase in price of building a 500-square-foot addition to a house, holding everything else in the model constant? The expected increase in price of building a 500-square-foot addition to a house is (Express your response as a percentage and round to two decimal places) Construct a 95% confidence interval for the percentage change in price. The 95% confidence interval for the percentage change in price is [ 1% (Express your response as a percentage and round to two decimal places) Use R" to compare the regressions in columns (1) and (2). Is it better to use Size or In(Size) to explain house prices? O A. It is better to use Size. O B. There is no difference between using Size or In(Size) O C. It is better to use In(Size). O D. It is better to use Size only if the distribution of house sizes is not normal. Using column (2), what is the estimated effect of a pool on price? The house price is estimated to increase by 1% (Express your response as a percentage and round to two decimal places) Construct a 95% confidence interval for this effect. The 95% confidence interval for this effect is [ 1% (Express your response as a percentage and round to two decimal places)The regression in column (3) adds the number of bedrooms to the regression. How large is the estimated effect of an additional bedroom? The house price is estimated to increase by (Express your response as a percentage and round to two decimal places) Is the coefficient on bedrooms in the regression in column (3) statistically significant? O A. The coefficient is not statistically significant. O B. The coefficient is statistically significant at the 5% significance level. O C. The coefficient is statistically significant at the 10% significance level. O D. The coefficient is statistically significant at the 1% significance level. How would you interpret the coefficient on bedrooms in the regression in column (3)? O A. The coefficient is a binary indicator that equals 1 if the house has more than five bedrooms. O B. The coefficient measures the effect of an additional bedroom holding the size of the house, and other factors, constant. O C. The coefficient measures the difference in price between houses with many bedrooms and those with just a few. O D. The coefficient measures the percentage increase in price associated with a one percent increase in the number of bedrooms holding other factors constant. Is the quadratic term In(Size) in the regression in column (4) statistically significant? O A. The coefficient is statistically significant at the 1% significance level. O B. The coefficient is not statistically significant. O C. The coefficient is statistically significant at the 5% significance level. O D. The coefficient is statistically significant at the 10% significance level.O A. The coefficient is statistically significant at the 1% significance level. O B. The coefficient is not statistically significant. O C. The coefficient is statistically significant at the 5% significance level. O D. The coefficient is statistically significant at the 10% significance level. Use the regression in column (5) to compute the expected increase in price when a pool is added to a house without a view. The house price is estimated to increase by (Express your response as a percentage and round to two decimal places) Use the regression in column (5) to compute the expected increase in price when a pool is added to a house with a view. The house price is estimated to increase by % (Express your response as a percentage and round to two decimal places) What is the difference between the effect of a pool on the price of a house with a view and a house without a view? The difference in the expected percentage change in price is o/ (Express your response as a percentage and round to two decimal places) Is this difference statistically significant? O A. The difference is statistically significant at the 5% significance level. O B. The difference is statistically significant at the 10% significance level. O C. The difference is statistically significant at the 1% significance level. O D. The difference is not statistically significant