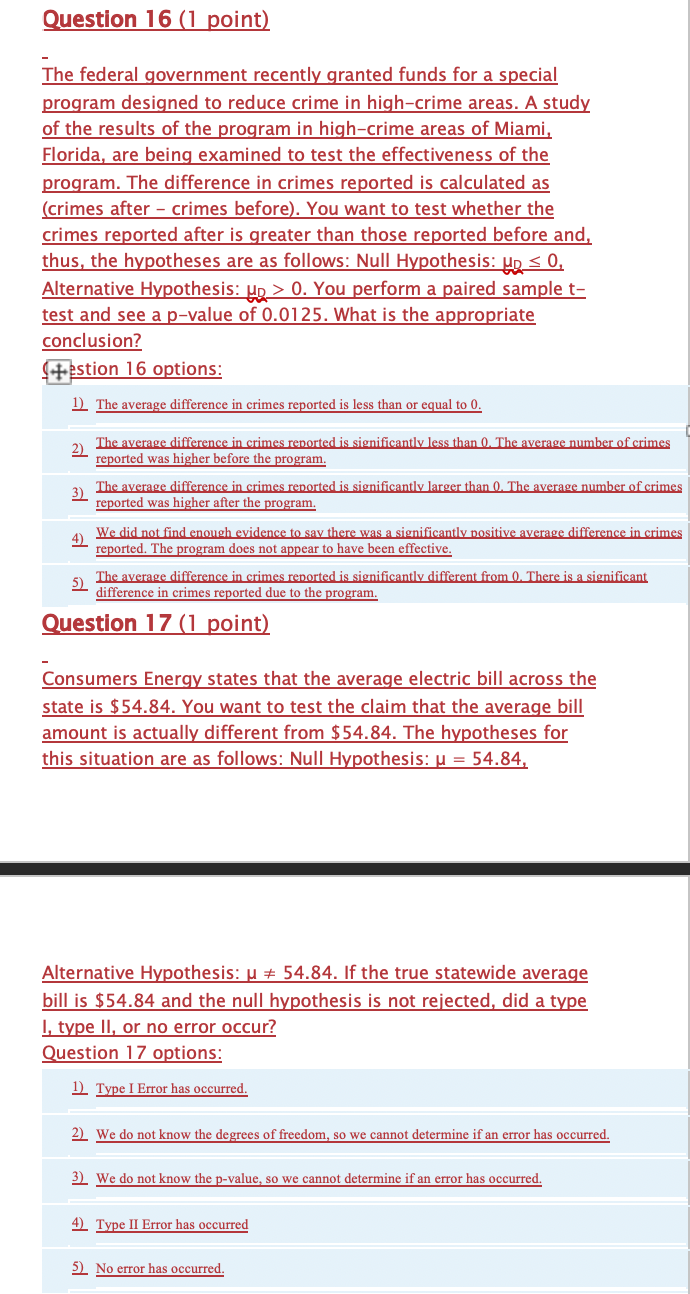
can you help me to solve these questions?
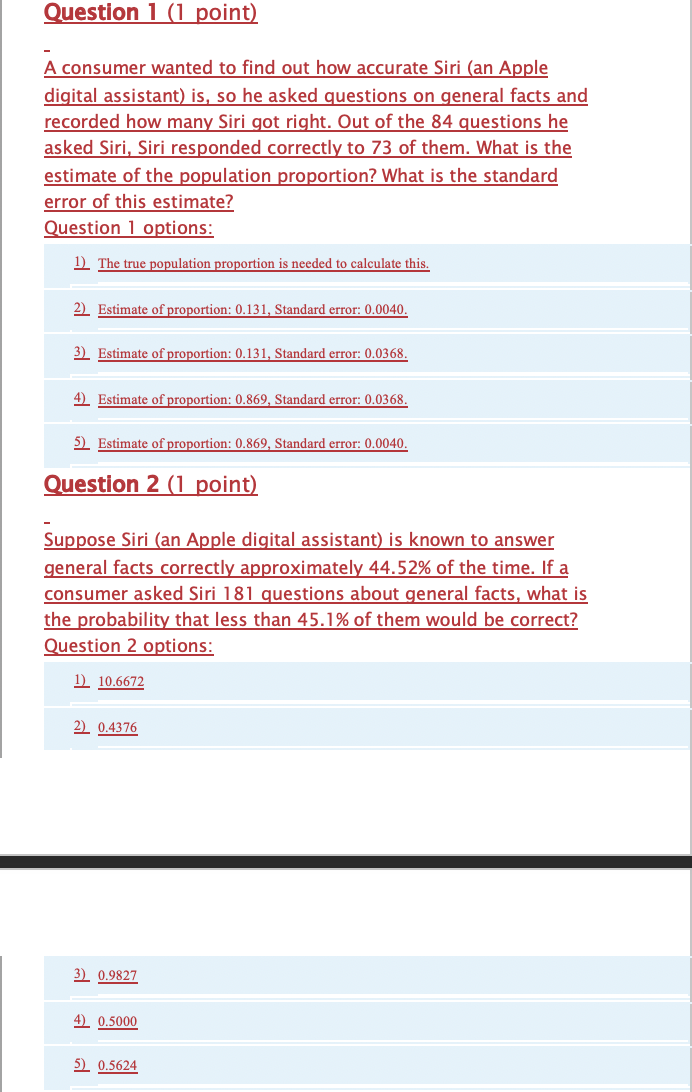
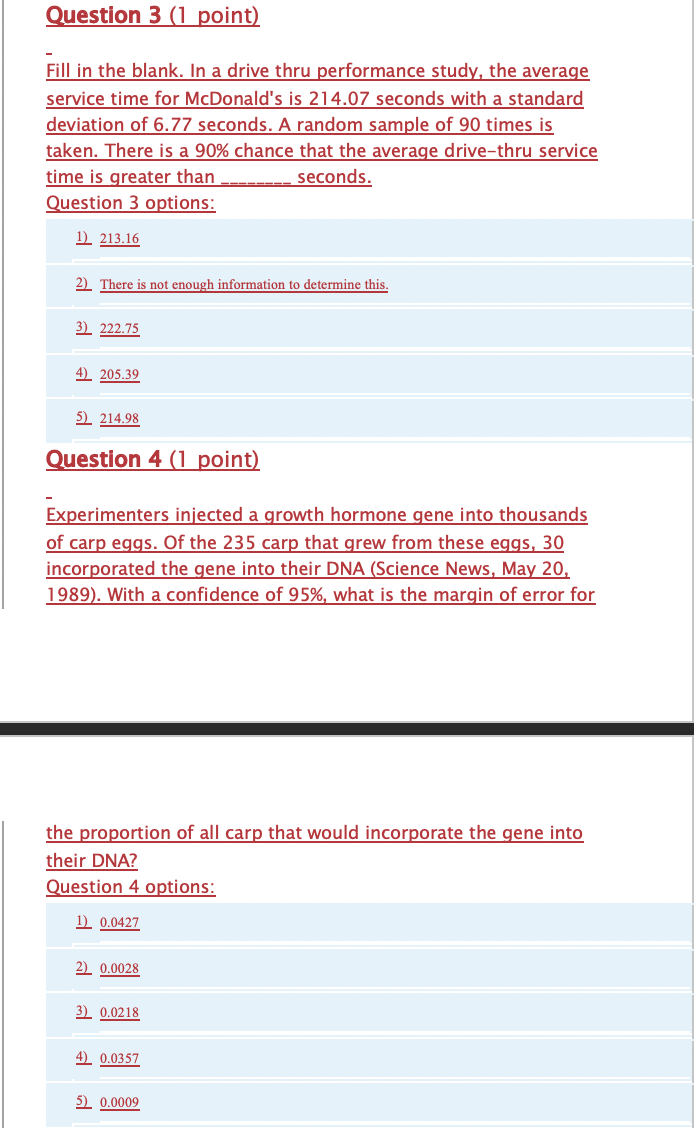
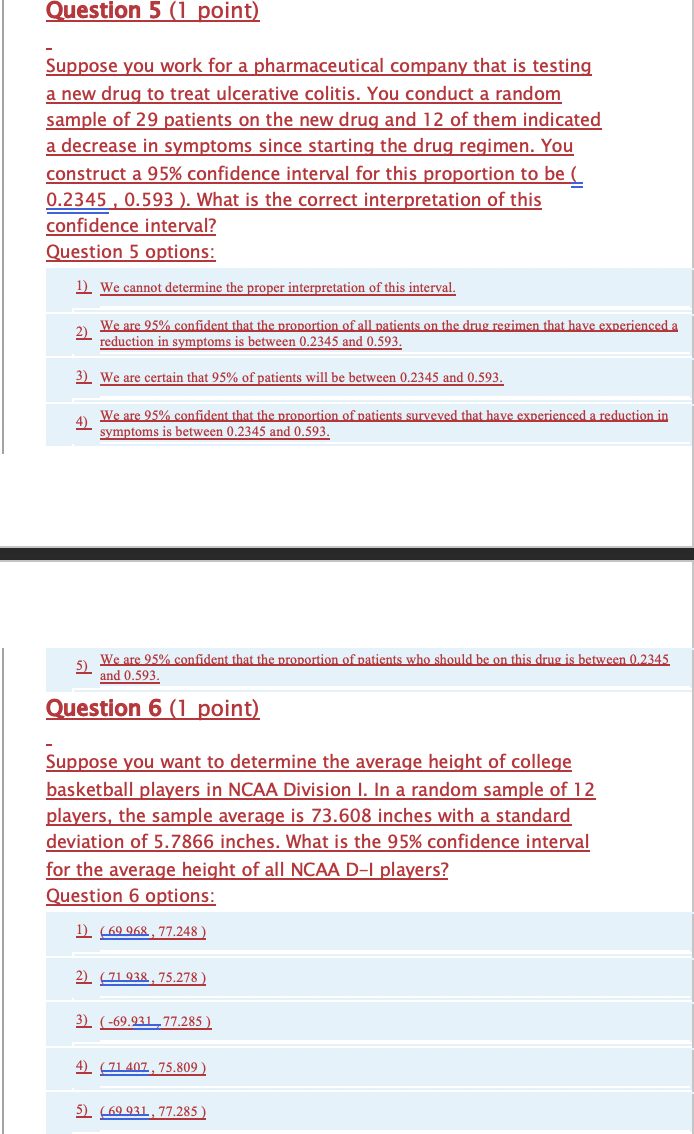
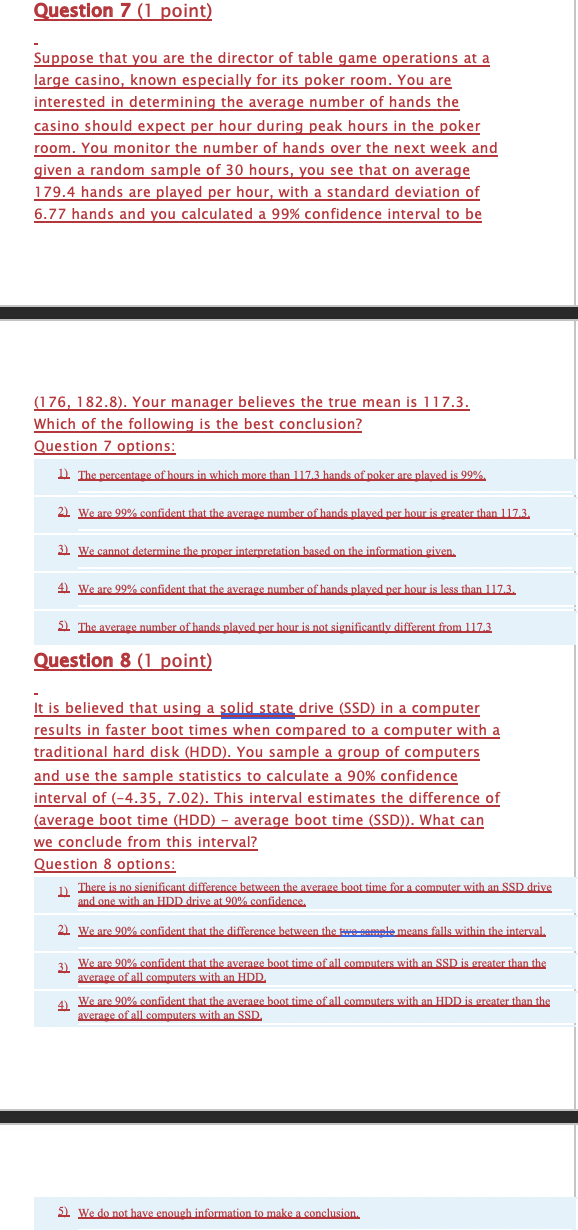
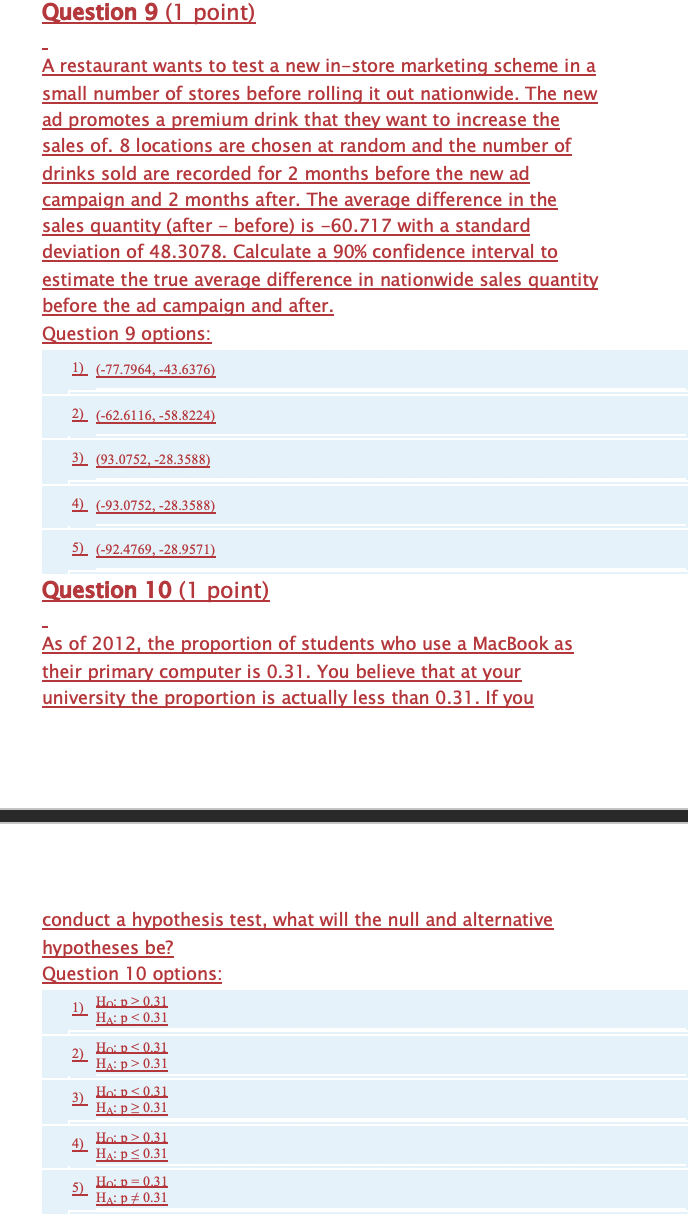
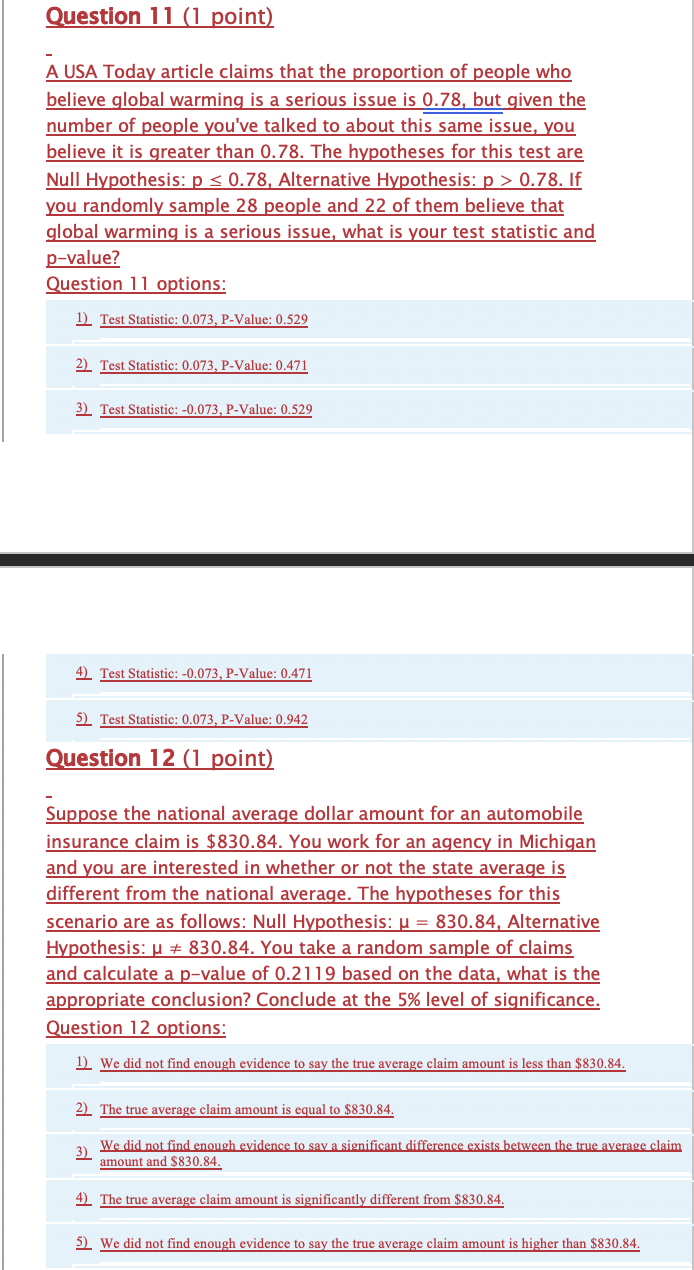
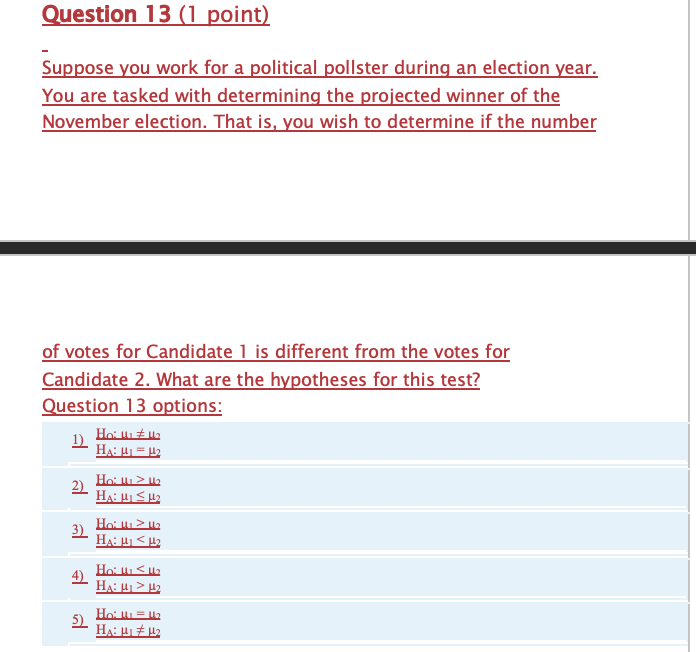
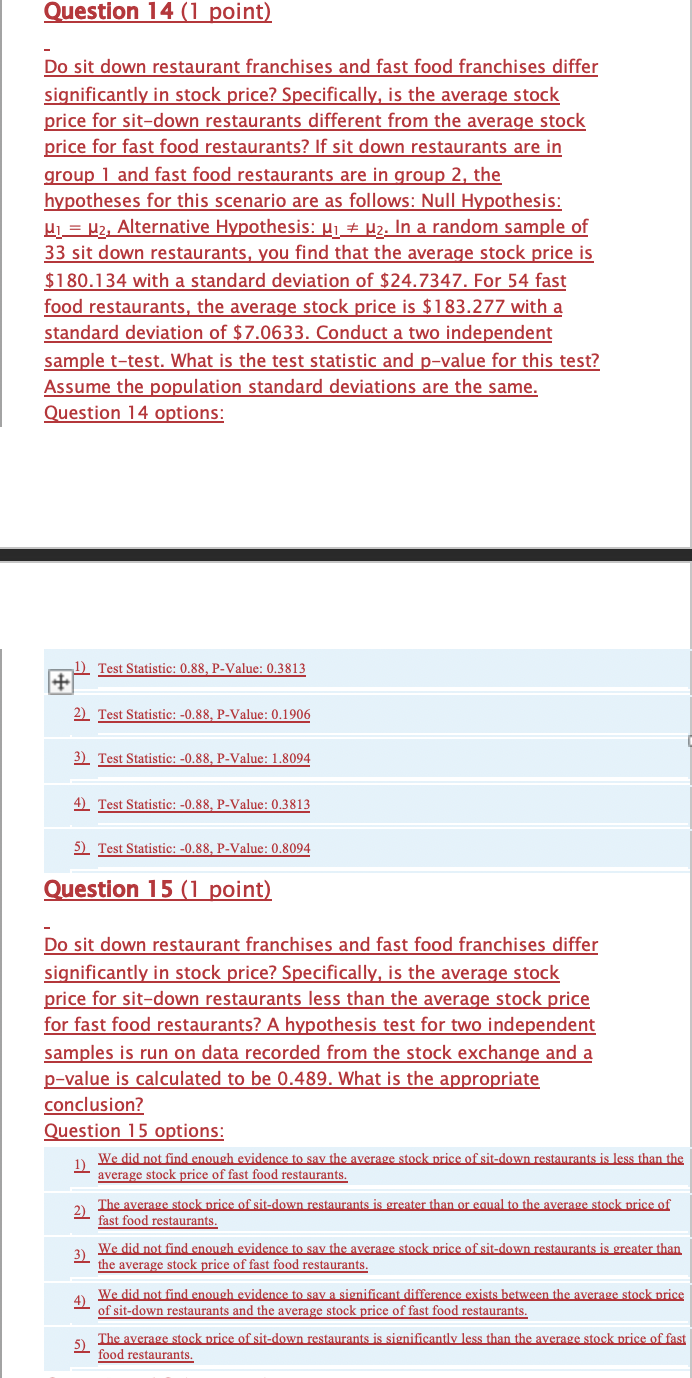
Question 1 (1 point) A consumer wanted to find out how accurate Siri (an Apple digital assistant) is, so he asked questions on general facts and recorded how many Siri got right. Out of the 84 questions he asked Siri, Siri responded correctly to 73 of them. What is the estimate of the population proportion? What is the standard error of this estimate? Question 1 options: 1) The true population proportion is needed to calculate this. 2) Estimate of proportion: 0.131, Standard error: 0.0040. 3) Estimate of proportion: 0.131, Standard error: 0.0368. 4) Estimate of proportion: 0.869, Standard error: 0.0368. 5) Estimate of proportion: 0.869, Standard error: 0.0040. Question 2 (1 point) Suppose Siri (an Apple digital assistant) is known to answer general facts correctly approximately 44.52% of the time. If a consumer asked Siri 181 questions about general facts, what is the probability that less than 45.1% of them would be correct? Question 2 options: 1) 10.6672 21 0.4376 3) 0.9827 4) 0.5000 5) 0.5624Question 3 (1 point) Fill in the blank. In a drive thru performance study, the average service time for Mcdonald's is 214.07 seconds with a standard deviation of 6.77 seconds. A random sample of 90 times is taken. There is a 90% chance that the average drive-thru service time is greater than seconds. Question 3 options: 1) 213.16 2) There is not enough information to determine this. 3) 222.75 4) 205.39 5) 214.98 Question 4 (1 point) Experimenters injected a growth hormone gene into thousands of carp eggs. Of the 235 carp that grew from these eggs, 30 incorporated the gene into their DNA (Science News, May 20, 1989). With a confidence of 95%, what is the margin of error for the proportion of all carp that would incorporate the gene into their DNA? Question 4 options: 1) 0.0427 2) 0.0028 3) 0.0218 4) 0.0357 5) 0.0009Question 5 (1 point) Suppose you work for a pharmaceutical company that is testing a new drug to treat ulcerative colitis. You conduct a random sample of 29 patients on the new drug and 12 of them indicated a decrease in symptoms since starting the drug regimen. You construct a 95% confidence interval for this proportion to be ( 0.2345 , 0.593 ). What is the correct interpretation of this confidence interval? Question 5 options: 1) We cannot determine the proper interpretation of this interval. 2) We are 95% confident that the proportion of all patients on the drug regimen that have experienced a reduction in symptoms is between 0.2345 and 0.593. 3) We are certain that 95% of patients will be between 0.2345 and 0.593. 4) We are 95% confident that the proportion of patients surveyed that have experienced a reduction in symptoms is between 0.2345 and 0.593. 5) We are 95% confident that the proportion of patients who should be on this drug is between 0.2345 and 0.593. Question 6 (1 point) Suppose you want to determine the average height of college basketball players in NCAA Division I. In a random sample of 12 players, the sample average is 73.608 inches with a standard deviation of 5.7866 inches. What is the 95% confidence interval for the average height of all NCAA D-I players? Question 6 options: 1) (69 968, 77.248 ) 2) (71 938, 75.278 ) 3) ( -69.931 77.285 ) 4) (71 407, 75.809 ) 5) (69 931, 77.285 )Question 7 (1 point) Suppose that you are the director of table game operations at a large casino, known especially for its poker room. You are interested in determining the average number of hands the casino should expect per hour during peak hours in the poker room. You monitor the number of hands over the next week and given a random sample of 30 hours, you see that on average 179.4 hands are played per hour, with a standard deviation of 6.77 hands and you calculated a 99% confidence interval to be (176, 182.8). Your manager believes the true mean is 117.3. Which of the following is the best conclusion? Question 7 options: 11 The percentage of hours in which more than 117.3 hands of poker are played is 99% 21 We are 99% confident that the average number of hands plaved per hour is greater than 117.3. 31 We cannot determine the proper interpretation based on the information given. 41 We are 99% confident that the average number of hands played per hour is less than 117.3. 51 The average number of hands plaved per hour is not significantly different from 117.3 Question 8 (1 point) It is believed that using a solid state drive (SSD) in a computer results in faster boot times when compared to a computer with a traditional hard disk (HDD). You sample a group of computers and use the sample statistics to calculate a 90% confidence interval of (-4.35, 7.02). This interval estimates the difference of (average boot time (HDD) - average boot time (SSD)). What can we conclude from this interval? Question 8 options: 1) There is no significant difference between the average boot time for a computer with an SSD drive and one with an HDD drive at 90%% confidence. 21 We are 90% confident that the difference between the tre sample means falls within the interval 3) We are 90% confident that the average boot time of all computers with an SSD is greater than the average of all computers with an HDD 4) We are 90% confident that the average boot time of all computers with an HDD is greater than the average of all computers with an SSD. 5 We do not have enough information to make a conclusion.Question 9 (1 point) A restaurant wants to test a new in-store marketing scheme in a small number of stores before rolling it out nationwide. The new ad promotes a premium drink that they want to increase the sales of. 8 locations are chosen at random and the number of drinks sold are recorded for 2 months before the new ad campaign and 2 months after. The average difference in the sales quantity (after - before) is -60.717 with a standard deviation of 48.3078. Calculate a 90% confidence interval to estimate the true average difference in nationwide sales quantity before the ad campaign and after. Question 9 options: 1) (-77.7964, -43.6376) 2) (-62.6116, -58.8224) 3) (93.0752, -28.3588) 4) (-93.0752, -28.3588) 5) (-92.4769, -28.9571) Question 10 (1 point) As of 2012, the proportion of students who use a MacBook as their primary computer is 0.31. You believe that at your university the proportion is actually less than 0.31. If you conduct a hypothesis test, what will the null and alternative hypotheses be? Question 10 options: 1) Hoin > 0.31 HA: p 0.31 3) Hoin 0.31 HA: p 0.78. If you randomly sample 28 people and 22 of them believe that global warming is a serious issue, what is your test statistic and p-value? Question 11 options: 1) Test Statistic: 0.073, P-Value: 0.529 2) Test Statistic: 0.073, P-Value: 0.471 3) Test Statistic: -0.073, P-Value: 0.529 4) Test Statistic: -0.073, P-Value: 0.471 5) Test Statistic: 0.073, P-Value: 0.942 Question 12 (1 point) Suppose the national average dollar amount for an automobile insurance claim is $830.84. You work for an agency in Michigan and you are interested in whether or not the state average is different from the national average. The hypotheses for this scenario are as follows: Null Hypothesis: u = 830.84, Alternative Hypothesis: u # 830.84. You take a random sample of claims and calculate a p-value of 0.2119 based on the data, what is the appropriate conclusion? Conclude at the 5% level of significance. Question 12 options: 1) We did not find enough evidence to say the true average claim amount is less than $830.84. 2) The true average claim amount is equal to $830.84. 3) We did not find enough evidence to say a significant difference exists between the true average claim amount and $830.84. 4) The true average claim amount is significantly different from $830.84. 5) We did not find enough evidence to say the true average claim amount is higher than $830.84.Question 13 (1 point) Suppose you work for a political pollster during an election year. You are tasked with determining the projected winner of the November election. That is, you wish to determine if the number of votes for Candidate 1 is different from the votes for Candidate 2. What are the hypotheses for this test? Question 13 options: 1) Ho: wi # 12 2) Ho: 1 2 12 HA: HI S H2 3) Ho: 1 2 12 HA: HI - 12 4) Hail = 12 HA: ( > U2 5) HA: HI # 12Question 14 (1 point) Do sit down restaurant franchises and fast food franchises differ significantly in stock price? Specifically, is the average stock price for sit-down restaurants different from the average stock price for fast food restaurants? If sit down restaurants are in group 1 and fast food restaurants are in group 2, the hypotheses for this scenario are as follows: Null Hypothesis: HI_= 12, Alternative Hypothesis: H1 # 12. In a random sample of 33 sit down restaurants, you find that the average stock price is $180.134 with a standard deviation of $24.7347. For 54 fast food restaurants, the average stock price is $183.277 with a standard deviation of $7.0633. Conduct a two independent sample t-test. What is the test statistic and p-value for this test? Assume the population standard deviations are the same. Question 14 options: 1) Test Statistic: 0.88, P-Value: 0.3813 2) Test Statistic: -0.88, P-Value: 0.1906 3) Test Statistic: -0.88, P-Value: 1.8094 4) Test Statistic: -0.88, P-Value: 0.3813 5) Test Statistic: -0.88, P-Value: 0.8094 Question 15 (1 point) Do sit down restaurant franchises and fast food franchises differ significantly in stock price? Specifically, is the average stock price for sit-down restaurants less than the average stock price for fast food restaurants? A hypothesis test for two independent samples is run on data recorded from the stock exchange and a p-value is calculated to be 0.489. What is the appropriate conclusion? Question 15 options: 1) We did not find enough evidence to say the average stock price of sit-down restaurants is less than the average stock price of fast food restaurants. 2) The average stock price of sit-down restaurants is greater than or equal to the average stock price of fast food restaurants. 3) We did not find enough evidence to say the average stock price of sit-down restaurants is greater than the average stock price of fast food restaurants. 4) We did not find enough evidence to say a significant difference exists between the average stock price of sit-down restaurants and the average stock price of fast food restaurants. The average stock price of sit-down restaurants is significantly less than the average stock price of fast food restaurants.Question 16 (1 point) The federal government recently granted funds for a special program designed to reduce crime in high-crime areas. A study of the results of the program in high-crime areas of Miami, Florida, are being examined to test the effectiveness of the program. The difference in crimes reported is calculated as (crimes after - crimes before). You want to test whether the crimes reported after is greater than those reported before and, thus, the hypotheses are as follows: Null Hypothesis: Up S 0, Alternative Hypothesis: Up > 0. You perform a paired sample t- test and see a p-value of 0.0125. What is the appropriate conclusion? (testion 16 options: 1) The average difference in crimes reported is less than or equal to 0. 2) The average difference in crimes reported is significantly less than 0. The average number of crimes reported was higher before the program. 3) The average difference in crimes reported is significantly larger than 0. The average number of crimes reported was higher after the program. 4) We did not find enough evidence to say there was a significantly positive average difference in crimes reported. The program does not appear to have been effective. The average difference in crimes reported is significantly different from 0. There is a significant difference in crimes reported due to the program. Question 17 (1 point) Consumers Energy states that the average electric bill across the state is $54.84. You want to test the claim that the average bill amount is actually different from $54.84. The hypotheses for this situation are as follows: Null Hypothesis: u = 54.84, Alternative Hypothesis: u # 54.84. If the true statewide average bill is $54.84 and the null hypothesis is not rejected, did a type I, type II, or no error occur? Question 17 options: 1) Type I Error has occurred. 2) We do not know the degrees of freedom, so we cannot determine if an error has occurred. 3) We do not know the p-value, so we cannot determine if an error has occurred. 4) Type II Error has occurred 5) No error has occurred
