Can you help me to solve this question using the formula table below? and show me the calculations step and if there need to draw the graph as well? thanks.
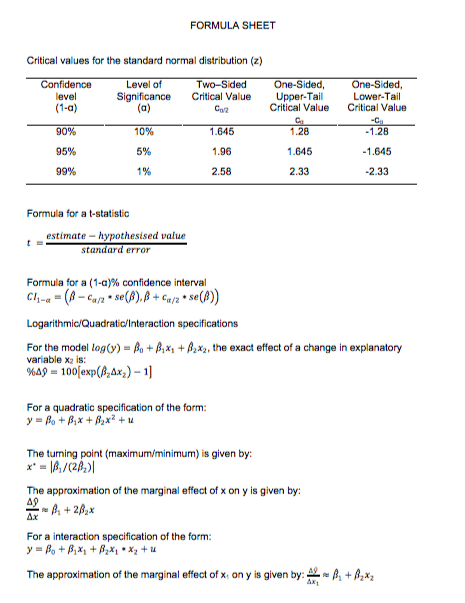
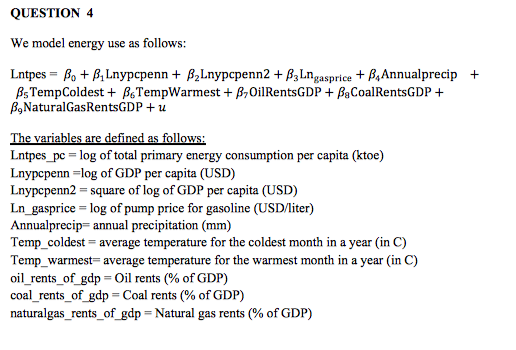
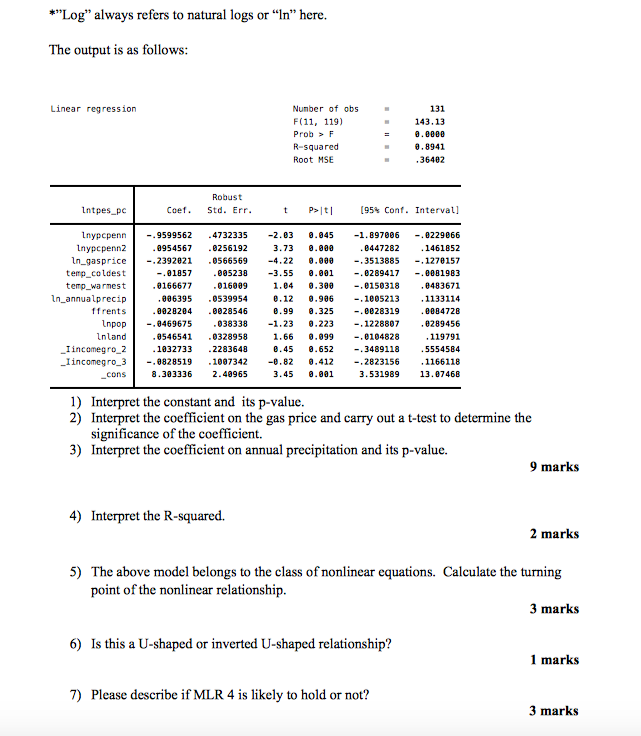
FORMULA SHEET Critical values for the standard normal distribution (z) Confidence Level of Two-Sided One-Sided, One-Sided, level Significance Critical Value Upper-Tail Lower-Tail (1-a) (a) Critical Value Critical Value -Ca 90% 10% 1.645 1.28 -1.28 95% 5% 1.96 1.645 -1.645 99% 1% 2.58 2.33 -2.33 Formula for a t-statistic estimate - hypothesised value standard error Formula for a (1-a)% confidence interval Chi-a = (A - Car . se( B). B + Carz * se(#)) Logarithmic/Quadratic/Interaction specifications variable xz is: For the model log(y) = So + Bix, + 2x2, the exact effect of a change in explanatory 149 = 100[exp(624x2) - 1] For a quadratic specification of the form: y' = Po + Bix + fax+ 1 The turning point (maximum/minimum) is given by: The approximation of the marginal effect of x on y is given by: A.x For a interaction specification of the form: " = Bo + Bix + By* * *2 + u The approximation of the marginal effect of x, on y is given by: = = A + 2x2QUESTION 4 We model energy use as follows: Lotpes = Bo + 8, Lnypcpenn + 82Lnypcpenn2 + 83Lngasprice + B,Annualprecip + As TempColdest + sTempWarmest + ,OilRentsGDP + ,CoalRentsGDP + B,NaturalGasRentsGDP + 1 The variables are defined as follows; Lotpes_pc = log of total primary energy consumption per capita (ktoe) Lnypcpenn =log of GDP per capita (USD) Lnypcpenn2 = square of log of GDP per capita (USD) Ln_gasprice = log of pump price for gasoline (USD/liter) Annualprecip= annual precipitation (mm) Temp_coldest = average temperature for the coldest month in a year (in C) Temp_warmest= average temperature for the warmest month in a year (in C) oil_rents_of gdp = Oil rents (% of GDP) coal_rents_of gdp = Coal rents (% of GDP) naturalgas_rents_of gdp = Natural gas rents (% of GDP)*"Log" always refers to natural logs or "In" here. The output is as follows: Linear regression Number of obs 131 F (11, 119) 143. 13 Prob > F R-squared II D. 8080 0. 8941 Root MSE 36482 Robust Intpes_pc Coel. Std. Err. (95% Conf. Interval] Inypepenn -. 9599562 4732335 -2.03 0.045 -1. 897006 -. 0229066 Inypepenn2 0954567 0256192 3.73 0.006 0447282 . 1461852 In_gasprice -. 2392021 0566569 -4.22 -. 3513885 -. 1270157 temp_coldest -. 01057 005230 -3.55 0.001 -. 0289417 -. 0001983 temp_warmest . 0166677 1.04 0.308 -. 0150318 . 0483671 In_annualprecip 0539954 e. 12 0.906 -. 1005213 1133114 ffrents . 0020204 0028546 0.99 0.325 -. 0028319 . 0804720 Inpop -. 0469675 038338 -1.23 0.223 -. 1228807 0289456 Inland 8546541 0328958 1.66 0.099 -. 0104828 . 119791 Iincomegro_2 . 1032733 - 2283640 0. 45 0. 652 -. 3489118 5554584 Iincomegro_3 -. 0828519 . 1097342 -0.82 0. 412 -. 2823156 . 1166118 _cons 8.303336 2. 40965 3.45 0.901 3.531989 13 . 07468 1) Interpret the constant and its p-value. 2) Interpret the coefficient on the gas price and carry out a t-test to determine the significance of the coefficient. 3) Interpret the coefficient on annual precipitation and its p-value. 9 marks 4) Interpret the R-squared. 2 marks 5) The above model belongs to the class of nonlinear equations. Calculate the turning point of the nonlinear relationship. 3 marks 6) Is this a U-shaped or inverted U-shaped relationship? 1 marks 7) Please describe if MLR 4 is likely to hold or not? 3 marks