Can you help me understand this? Thank you.
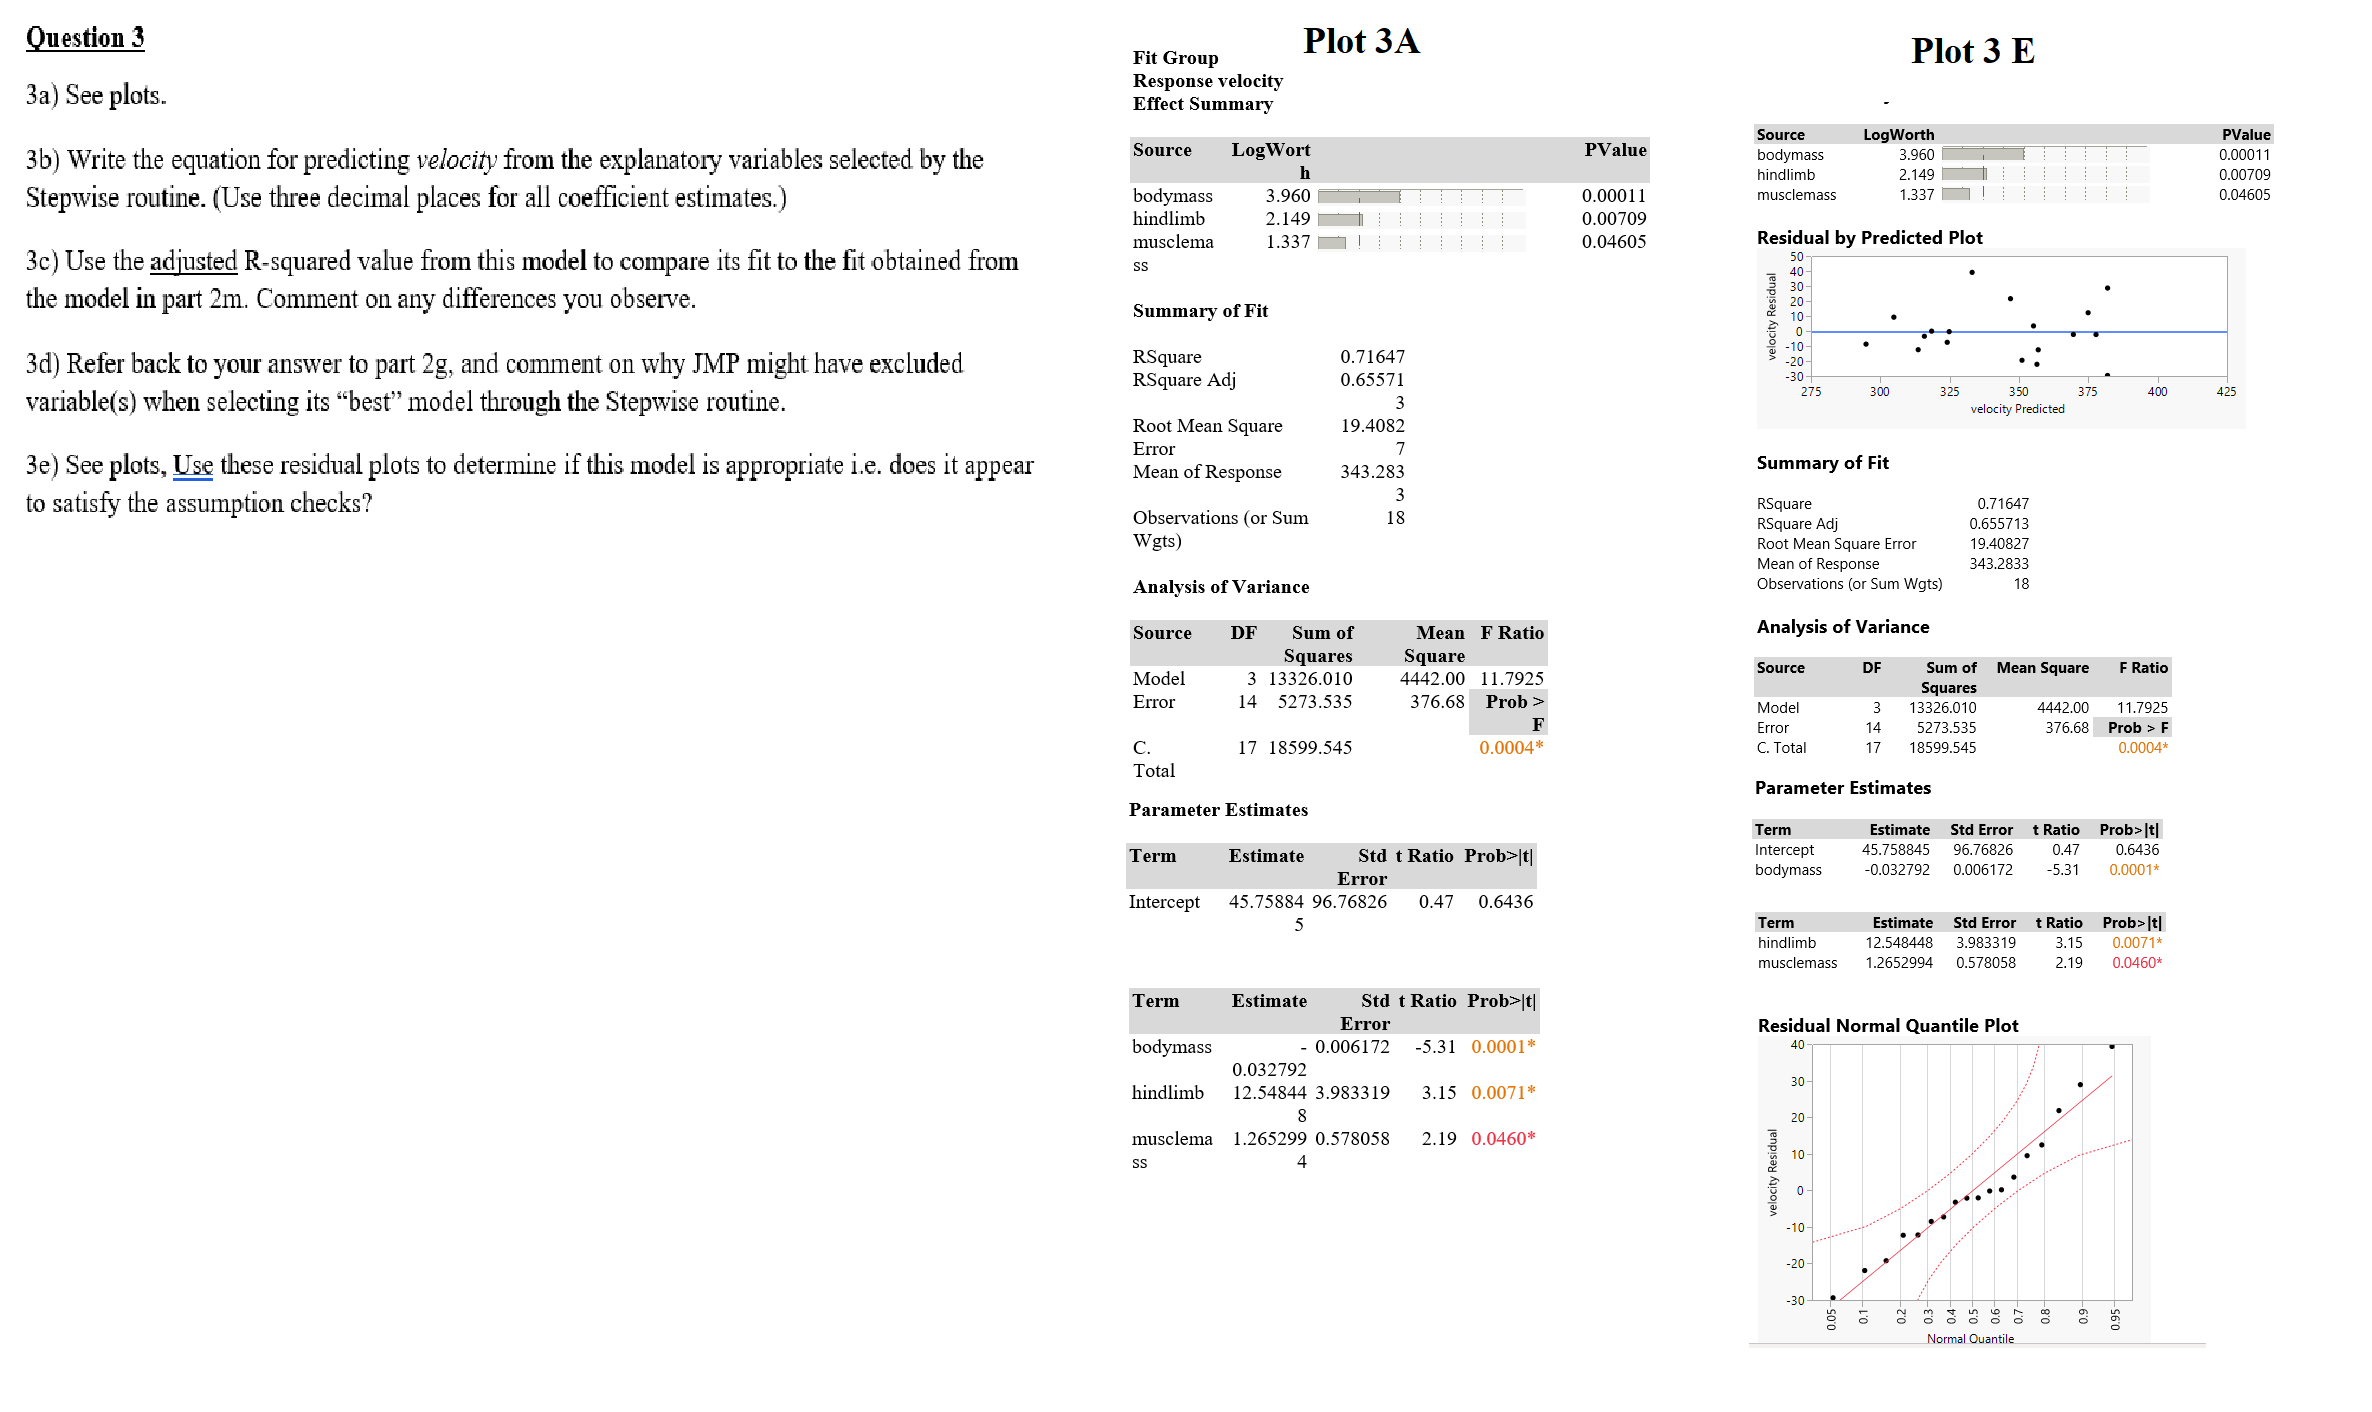
Question 3 Plot 3A Fit Group Plot 3 E Response velocity 3a) See plots. Effect Summary Source LogWorth PValue 3b) Write the equation for predicting velocity from the explanatory variables selected by the Source Log Wort PValue bodymass 3.960 0.0001 hindlimb 2.149 0.00709 Stepwise routine. (Use three decimal places for all coefficient estimates.) bodymass 3.960 0.0001 1 musclemass 1.337 .04605 hindlimb 2.149 0.00709 musclema 1.337 0.04605 Residual by Predicted Plot 3c) Use the adjusted R-squared value from this model to compare its fit to the fit obtained from SS the model in part 2m. Comment on any differences you observe. Summary of Fit doodbyb velocity Residua 3d) Refer back to your answer to part 2g, and comment on why JMP might have excluded RSquare 0.71647 RSquare Adj 0.65571 30 275 300 325 350 375 400 425 variable(s) when selecting its "best" model through the Stepwise routine. velocity Predicted Root Mean Square 19.4082 Error 3e) See plots, Use these residual plots to determine if this model is appropriate i.e. does it appear Mean of Response 343.283 Summary of Fit to satisfy the assumption checks? RSquare 0.71647 Observations (or Sum 18 Square Adj 0.655713 Wgts) Root Mean Square Error 19.40827 Mean of Response 343.2833 Analysis of Variance Observations (or Sum Wgts) 18 Source DF Sum of Mean F Ratio Analysis of Variance Squares Square DE 3 13326.010 4442.00 11.7925 Source Sum of Mean Square F Ratio Mode Squares Error 14 5273.535 376.68 Prob > Model 3 13326.010 4442.00 11.7925 F Error 14 5273.535 376.68 Prob > F 17 18599.545 0.0004* C. Total 17 18599.545 0.0004* Total Parameter Estimates Parameter Estimates Term Estimate Std Error t Ratio Prob>|t] Estimate Std t Ratio Prob>/t Intercept 45.758845 96.76826 0.47 Term 0.6436 bodymass -0.032792 0.006172 -5.31 0.0001* Error Intercept 45.75884 96.76826 0.47 0.6436 5 Term Estimate Std Error t Ratio Prob>/t] hindlimb 2.548448 3.983319 3.15 0.0071 musclemass 1.2652994 0.578058 2.19 0.0460* Term Estimate Std t Ratio Prob>|t Error Residual Normal Quantile Plot bodymass - 0.006172 -5.31 0.0001* 40- 0.032792 30 hindlimb 12.54844 3.983319 3.15 0.0071* 20 musclema 1.265299 0.578058 2.19 0.0460* 10- ss velocity Residual O -10- 20 30 0.05- 2 8 8 8 8 6 8 Normal Quantile


