Can you help out with these questions?
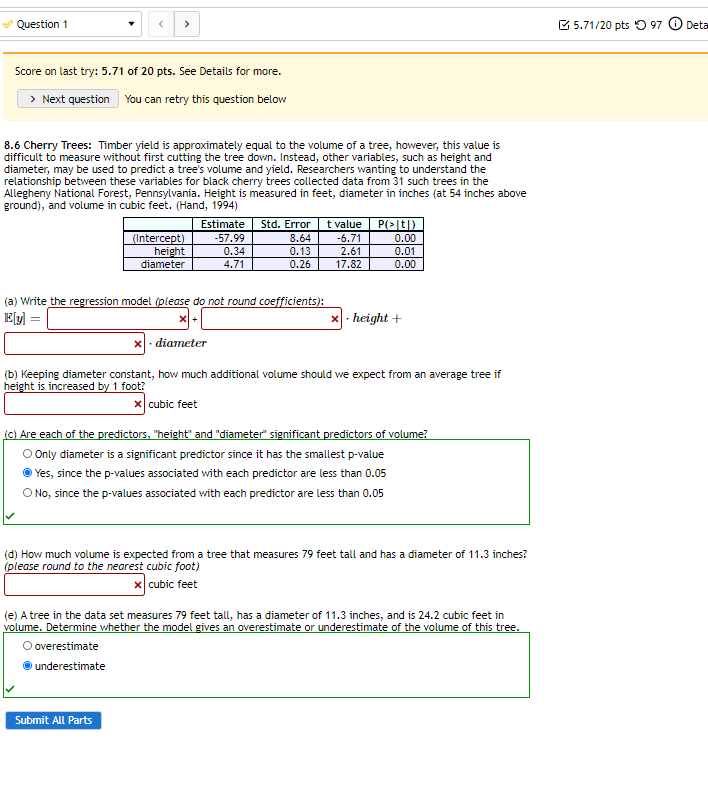
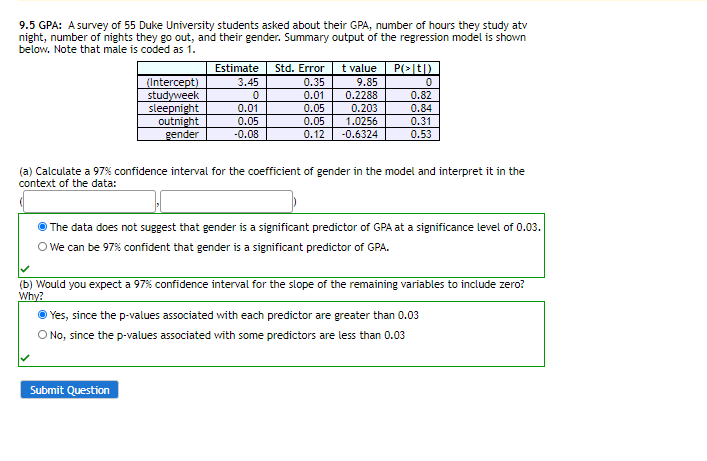
Question 1 @ 5.71/20 pts 0 97 0 Det Score on last try: 5.71 of 20 pts. See Details for more. > Next question | You can retry this question below 8.6 Cherry Trees: Timber yield is approximately equal to the volume of a tree, however, this value is difficult to measure without first cutting the tree down. Instead, other variables, such as height and diameter, may be used to predict a tree's volume and yield. Researchers wanting to understand the elationship between these variables for black cherry trees collected data from 31 such trees in the Allegheny National Forest, Pennsylvania. Height is measured in feet, diameter in inches (at 54 inches above ground), and volume in cubic feet. (Hand, 1994) Estimate Std. Error |t value P(>]t[) (Intercept) 57.99 3.64 -6.71 0.00 height 0.34 0.13 2.61 0.01 diameter 4.71 0.26| 17.82 0.00 (a) Write the regression model (please do not round coefficients): Ely = *+ height + x . diameter (b) Keeping diameter constant, how much additional volume should we expect from an average tree if height is increased by 1 foot? * cubic feet (c) Are each of the predictors, "height" and "diameter" significant predictors of volume? Only diameter is a significant predictor since it has the smallest p-value O'Yes, since the p-values associated with each predictor are less than 0.05 O No, since the p-values associated with each predictor are less than 0.05 (d) How much volume is expected from a tree that measures 79 feet tall and has a diameter of 11.3 inches? (please round to the nearest cubic foot) * cubic feet (e) A tree in the data set measures 79 feet tall, has a diameter of 11.3 inches, and is 24.2 cubic feet in volume. Determine whether the model gives an overestimate or underestimate of the volume of this tree. O overestimate O underestimate Submit All Parts9.5 GPA: A survey of 55 Duke University students asked about their GPA, number of hours they study atv night, number of nights they go out, and their gender. Summary output of the regression model is shown below. Note that male is coded as 1. Estimate Std. Error t value P( >[t[) (Intercept) 3.45 0.35 9.85 0 studyweek 0 0.01 0.2288 0.82 sleepnight 0.01 0.05 0.203 0.84 outnight 0.05 0.05 1.0256 0.31 gender -0.08 0.12 -0.6324 0.53 (a) Calculate a 97% confidence interval for the coefficient of gender in the model and interpret it in the context of the data: O The data does not suggest that gender is a significant predictor of GPA at a significance level of 0.03. O We can be 97% confident that gender is a significant predictor of GPA. (b) Would you expect a 97% confidence interval for the slope of the remaining variables to include zero? Why? O Yes, since the p-values associated with each predictor are greater than 0.03 O No, since the p-values associated with some predictors are less than 0.03 Submit


