Answered step by step
Verified Expert Solution
Question
1 Approved Answer
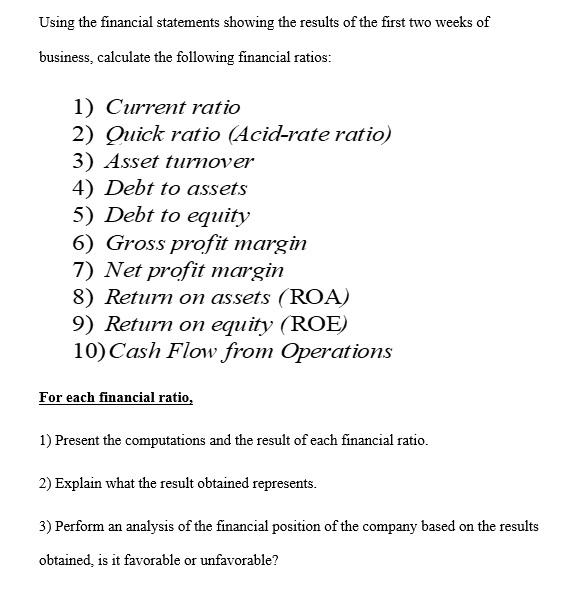
Can you help with the following financial ratio calculations? Please, refer to the following financial statements: Please, follow rules for each financial ratio 1-3 and
Can you help with the following financial ratio calculations? Please, refer to the following financial statements:
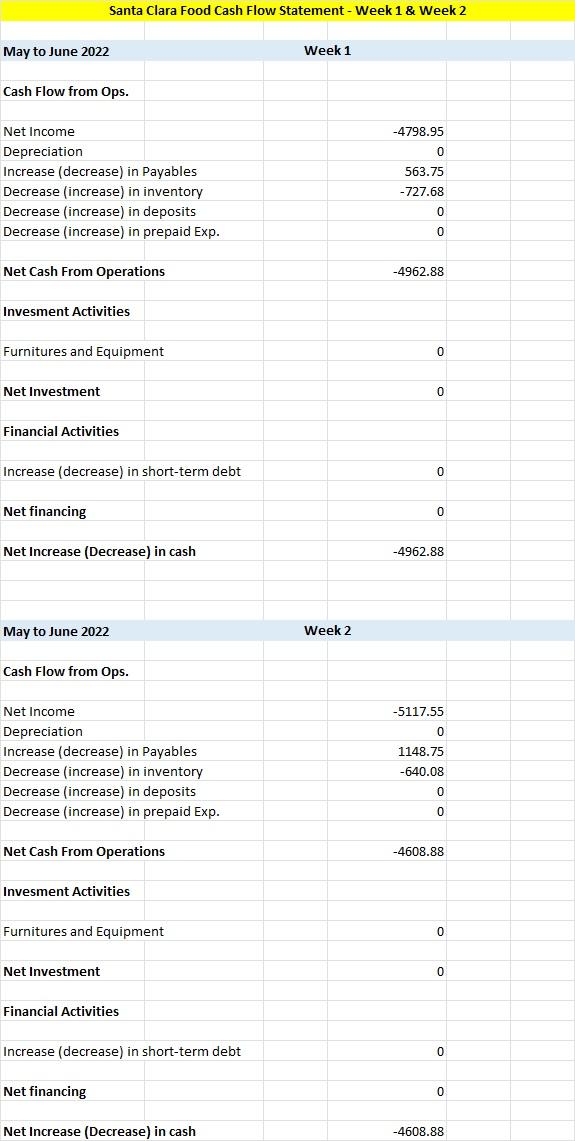
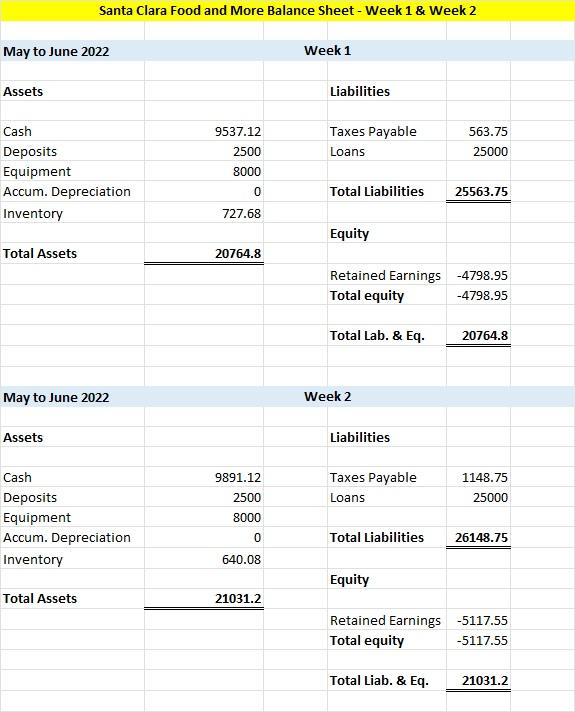
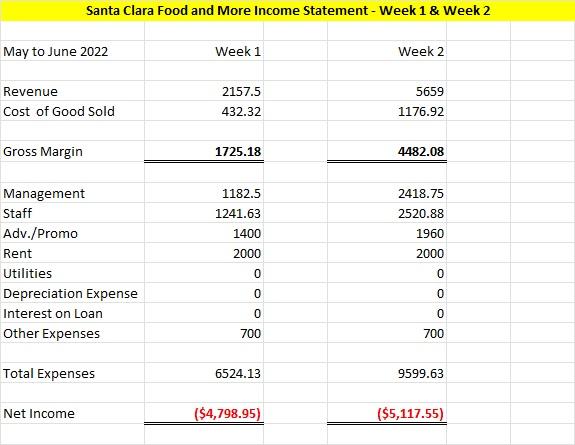
Please, follow rules for each financial ratio 1-3 and show computations for each one.
Santa Clara Food Cash Flow Statement - Week 1 & Week 2 Week 1 -4798.95 0 563.75 -727.68 0 0 -4962.88 0 0 0 0 -4962.88 -5117.55 0 1148.75 -640.08 0 0 -4608.88 0 0 0 0 -4608.88 May to June 2022 Cash Flow from Ops. Net Income Depreciation Increase (decrease) in Payables Decrease (increase) in inventory Decrease (increase) in deposits Decrease (increase) in prepaid Exp. Net Cash From Operations Invesment Activities Furnitures and Equipment Net Investment Financial Activities Increase (decrease) in short-term debt Net financing Net Increase (Decrease) in cash May to June 2022 Cash Flow from Ops. Net Income Depreciation Increase (decrease) in Payables Decrease (increase) in inventory Decrease (increase) in deposits Decrease (increase) in prepaid Exp. Net Cash From Operations Invesment Activities Furnitures and Equipment Net Investment Financial Activities Increase (decrease) in short-term debt Net financing Net Increase (Decrease) in cash Week 2 Santa Clara Food and More Balance Sheet - Week 1 & Week 2 Week 1 Liabilities 9537.12 Taxes Payable 563.75 25000 2500 Loans 8000 0 Total Liabilities 25563.75 727.68 Equity 20764.8 Retained Earnings -4798.95 Total equity -4798.95 Total Lab. & Eq. 20764.8 Liabilities Taxes Payable 1148.75 Loans 25000 Total Liabilities 26148.75 Equity Retained Earnings -5117.55 Total equity -5117.55 Total Liab. & Eq. 21031.2 May to June 2022 Assets Cash Deposits Equipment Accum. Depreciation Inventory Total Assets May to June 2022 Assets Cash Deposits Equipment Accum. Depreciation Inventory Total Assets 9891.12 2500 8000 0 640.08 21031.2 Week 2 Santa Clara Food and More Income Statement - Week 1 & Week 2 Week 1 Week 2 2157.5 5659 432.32 1176.92 1725.18 4482.08 1182.5 2418.75 1241.63 2520.88 1400 1960 2000 2000 0 0 0 0 700 6524.13 ($4,798.95) May to June 2022 Revenue Cost of Good Sold Gross Margin Management Staff Adv./Promo Rent Utilities Depreciation Expense Interest on Loan Other Expenses Total Expenses Net Income 0 0 700 9599.63 ($5,117.55) Using the financial statements showing the results of the first two weeks of business, calculate the following financial ratios: 1) Current ratio 2) Quick ratio (Acid-rate ratio) 3) Asset turnover 4) Debt to assets 5) Debt to equity 6) Gross profit margin 7) Net profit margin 8) Return on assets (ROA) 9) Return on equity (ROE) 10) Cash Flow from Operations For each financial ratio, 1) Present the computations and the result of each financial ratio. 2) Explain what the result obtained represents. 3) Perform an analysis of the financial position of the company based on the results obtained, is it favorable or unfavorableStep by Step Solution
There are 3 Steps involved in it
Step: 1

Get Instant Access to Expert-Tailored Solutions
See step-by-step solutions with expert insights and AI powered tools for academic success
Step: 2

Step: 3

Ace Your Homework with AI
Get the answers you need in no time with our AI-driven, step-by-step assistance
Get Started


