can you help with this please
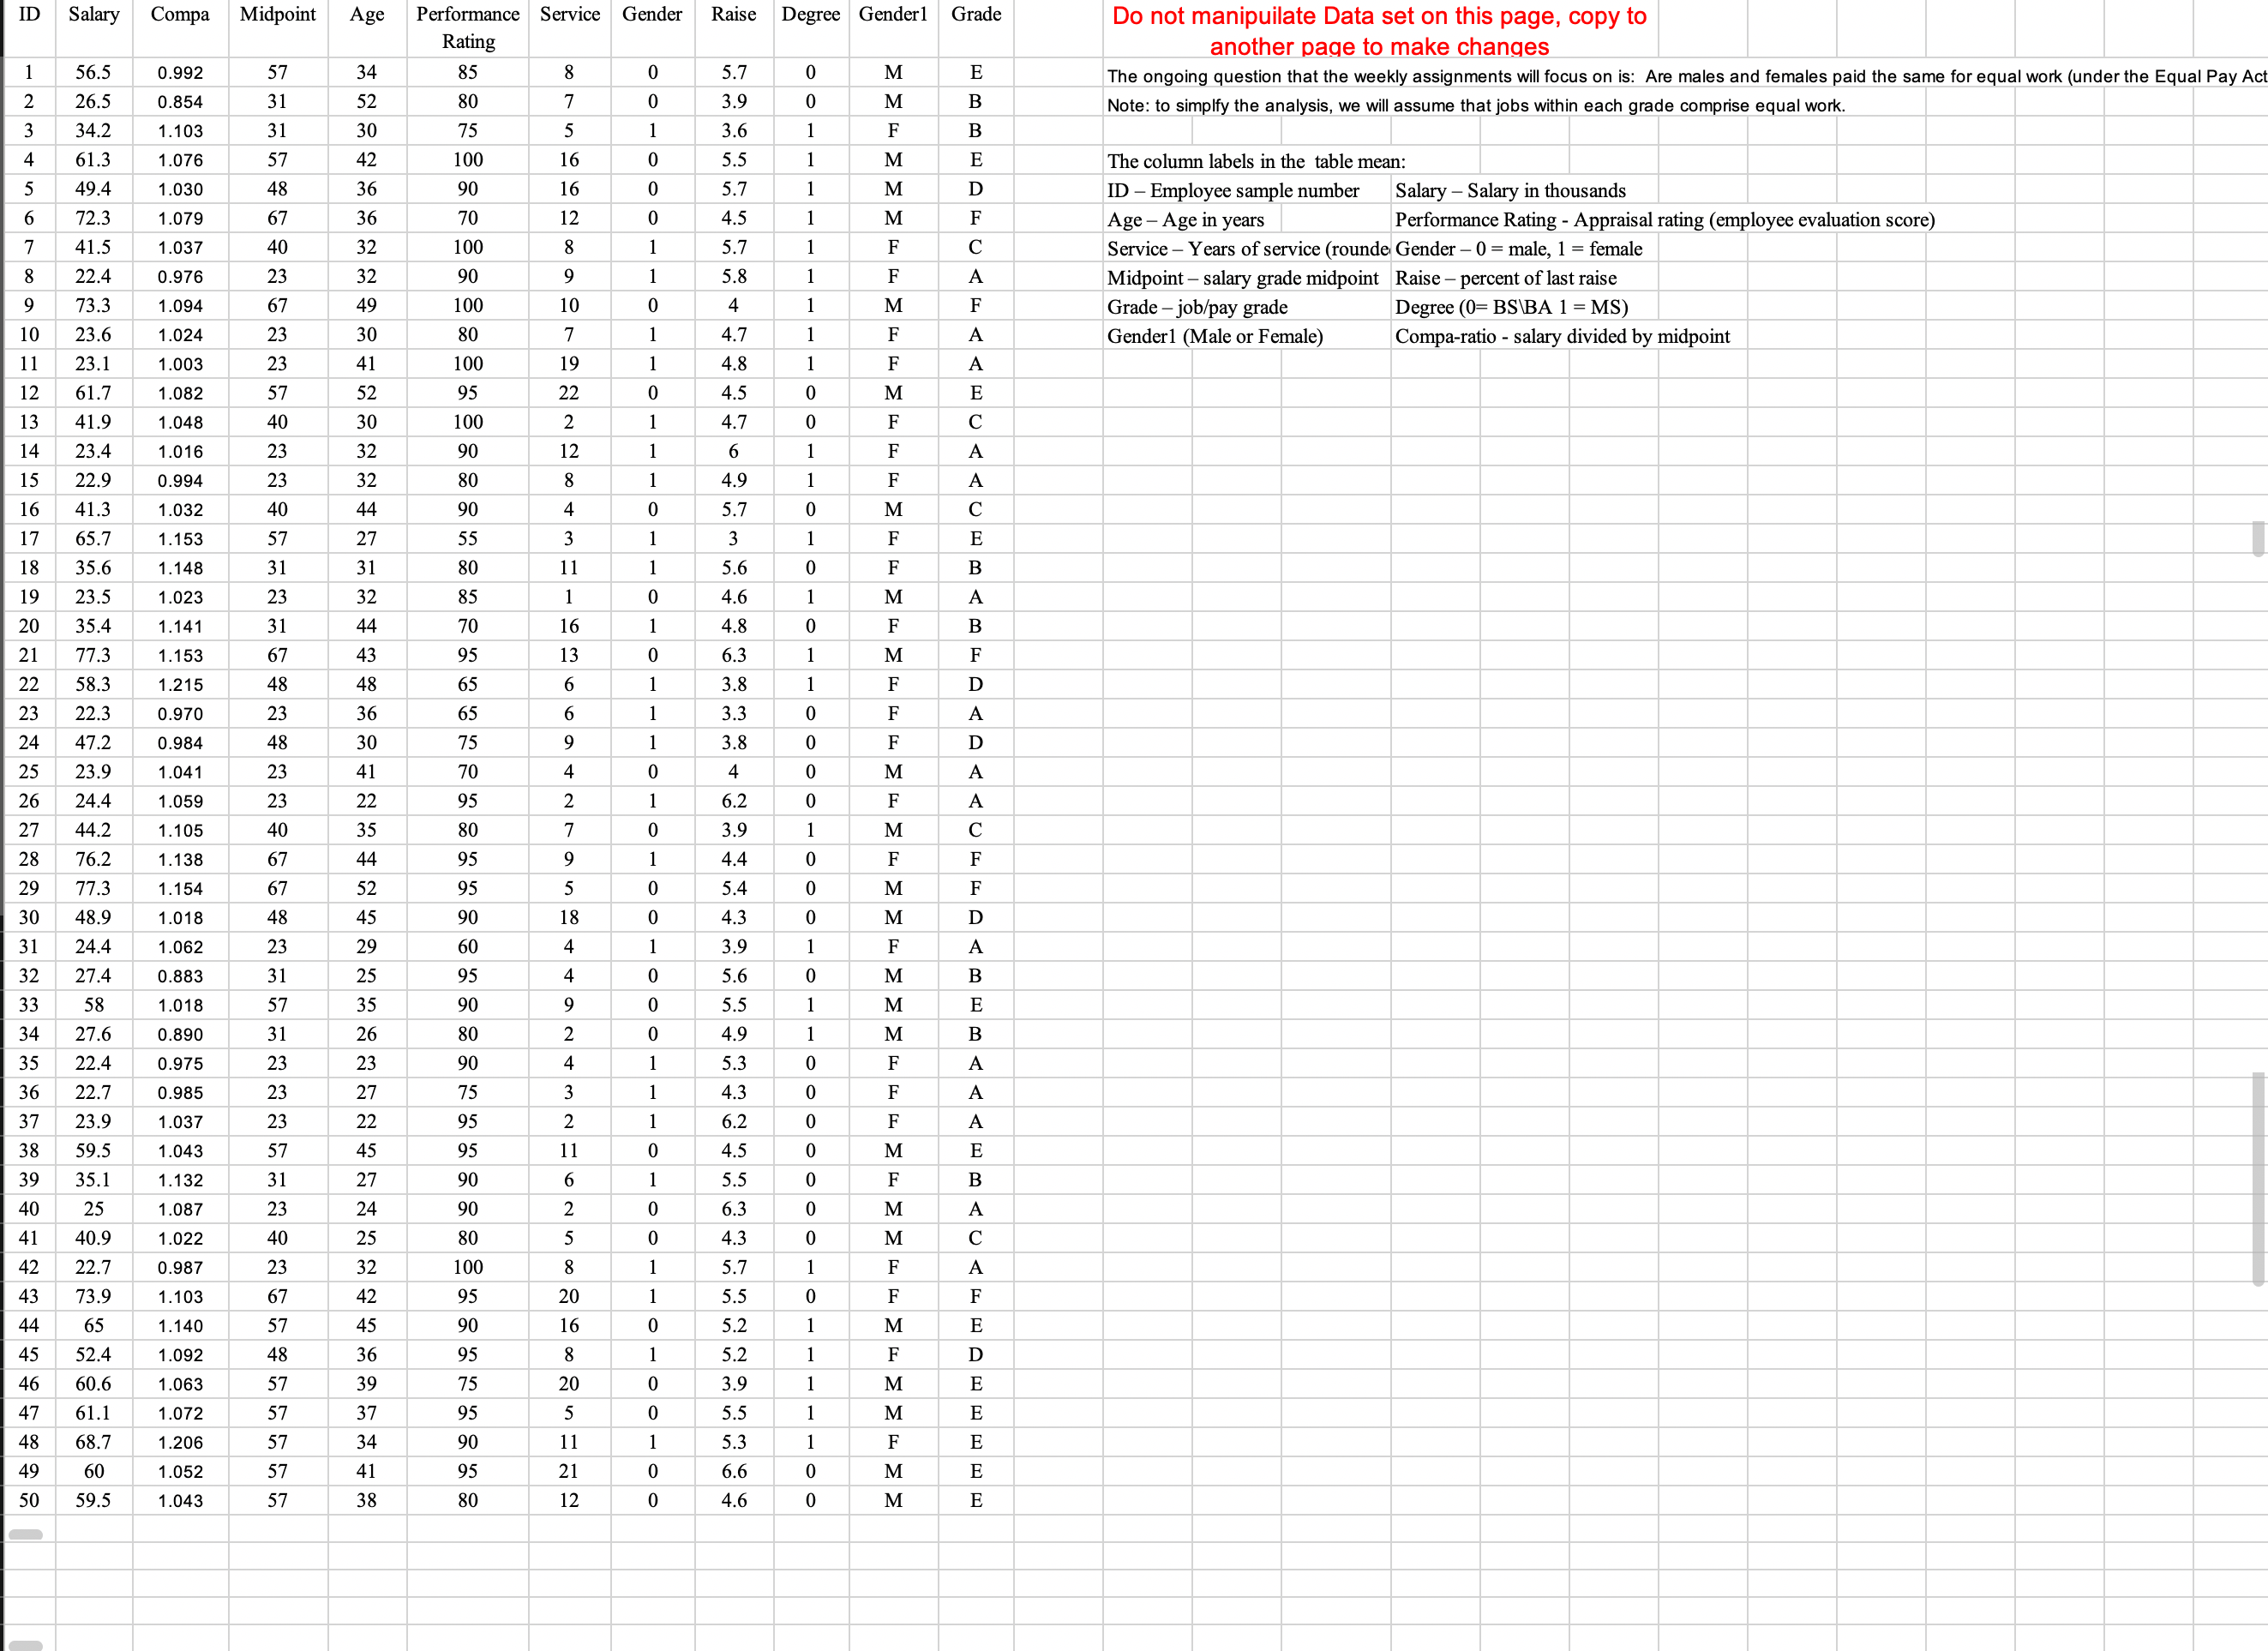
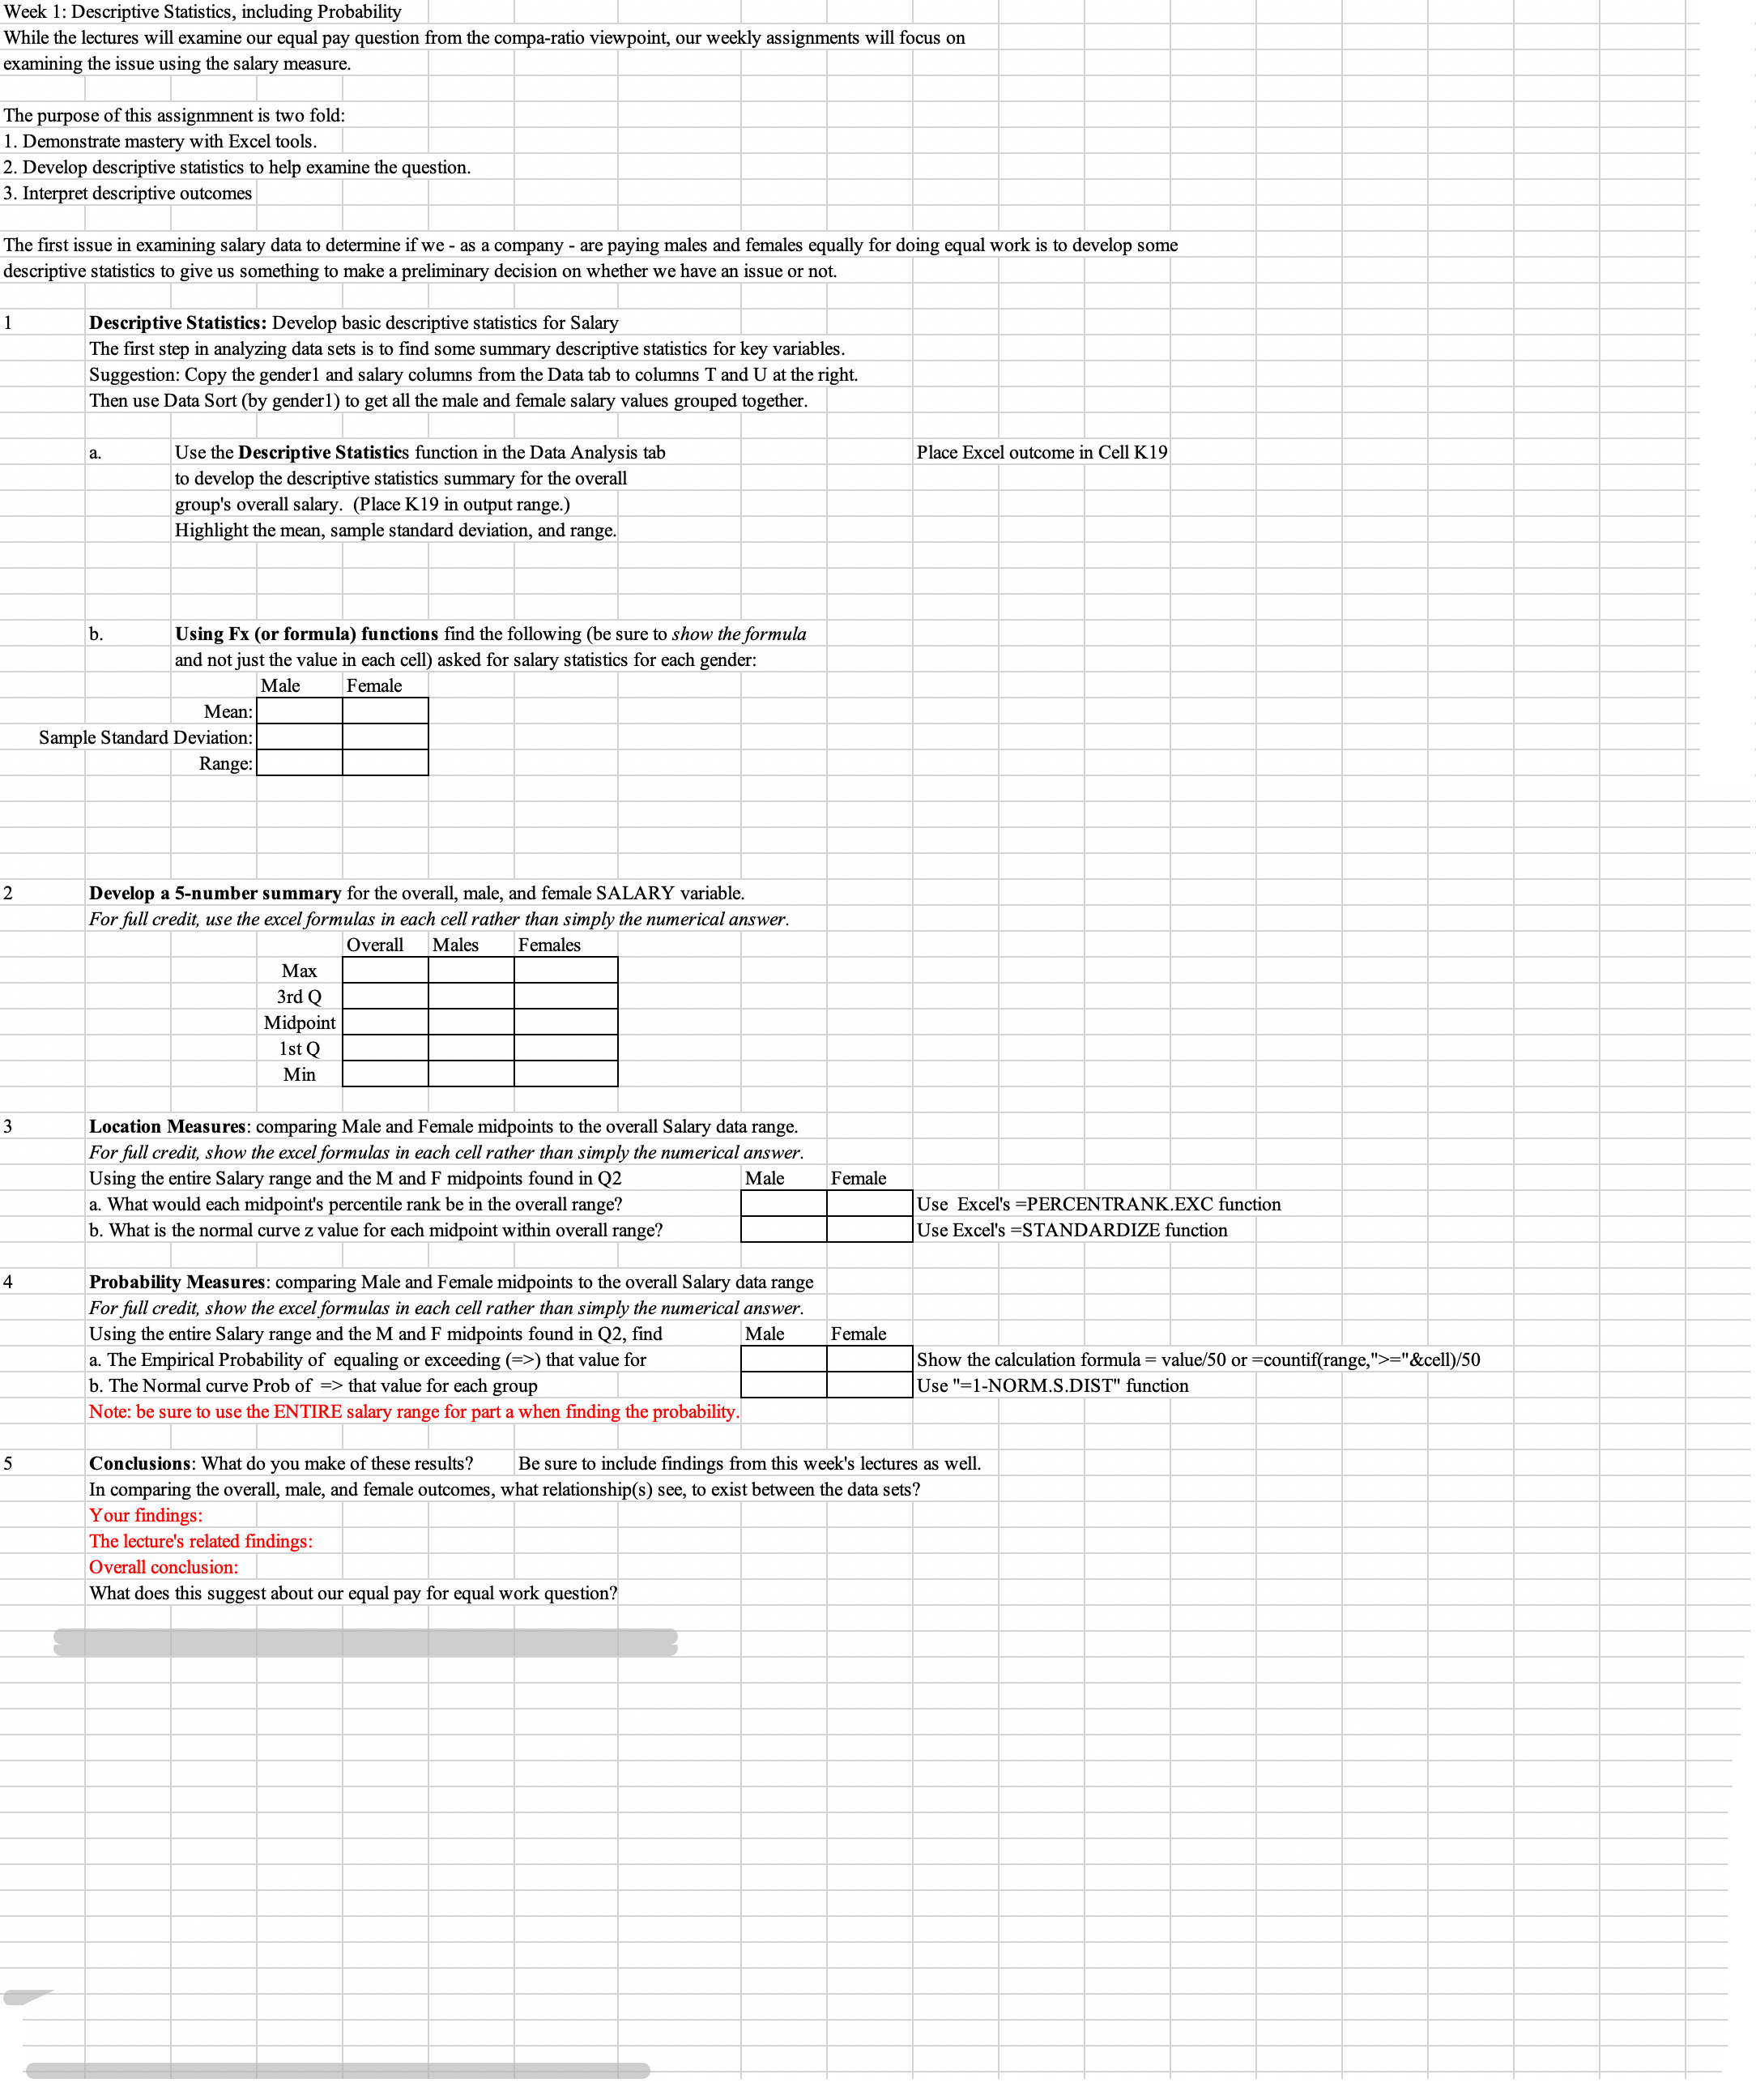
ID Salary Compa Midpoint Age Performance Service Gender Raise Degree Genderl Grade Do not manipuilate Data set on this page, copy to Rating another page to make changes 56.5 0.992 34 85 0 5.7 M E The ongoing question that the weekly assignments will focus on is: Are males and females paid the same for equal work (under the Equal Pay Ac A W N 31 52 80 M Note: to simply the analysis, we will assume that jobs within each grade comprise equal work. 26.5 0.85 34.2 1.103 31 30 75 3. 6 F 1.076 42 100 M The column labels in the table mean: 61.3 49.4 1.030 36 90 M ID - Employee sample number Salary - Salary in thousands 1.079 57 36 70 0 M F Age - Age in years Performance Rating - Appraisal rating (employee evaluation score) 72.3 41.5 1.037 32 100 5.7 F Service - Years of service (rounde Gender - 0 = male, 1 = female Midpoint - salary grade midpoint Raise - percent of last raise 22.4 0.97 32 90 5.8 A 73.3 1.094 49 100 0 M F Grade - job/pay grade Degree (0= BS\\BA 1 = MS) Compa-ratio - salary divided by midpoint 10 Gender1 (Male or Female) 23.6 1.024 30 80 11 23.1 1.00 41 100 12 61.7 1.082 95 13 41.9 1.048 30 100 14 23.4 1.016 32 90 15 22.9 0.994 32 80 16 41.3 1.032 44 17 65.7 .15 18 35.6 1.14 19 23.5 1.023 20 35.4 .14 21 77. .153 48 O 58.3 .215 22.3 0.970 36 47.2 .98 30 23.9 1.04 41 24.4 1.059 22 44.2 .10 76.2 1.13 17.3 1.15 30 48.9 .018 31 24.4 1.06 32 27.4 0.883 33 58 1.018 OC 34 27.6 0.89 35 22.4 0.975 36 22.7 0.985 37 23. 1.03 95 38 59.5 1.043 39 35.1 1.132 90 40 25 .08 90 41 40.9 1.022 42 22.7 0.98 100 73. .10 44 65 1.14 45 24 1.092 46 60.6 1.063 47 61.1 1.072 48 58. 1.206 49 60 1.052 O 50 59 1.043Week 1: Descriptive Statistics, including Probability While the lectures will examine our equal pay question from the compa-ratio viewpoint, our weekly assignments will focus on examining the issue using the salary measure. The purpose of this assignment is two fold: 1. Demonstrate mastery with Excel tools 2. Develop descriptive statistics to help examine the question. 3. Interpret descriptive outcomes The first issue in examining salary data to determine if we - as a company - are paying males and females equally for doing equal work is to develop some descriptive statistics to give us something to make a preliminary decision on whether we have an issue or not. Descriptive Statistics: Develop basic descriptive statistics for Salary The first step in analyzing data sets is to find some summary descriptive statistics for key variables. Suggestion: Copy the gender1 and salary columns from the Data tab to columns T and U at the right. Then use Data Sort (by gender1) to get all the male and female salary values grouped together. a. Use the Descriptive Statistics function in the Data Analysis tab to develop the descriptive statistics summary for the overall Place Excel outcome in Cell K19 group's overall salary. (Place K19 in output range.) Highlight the mean, sample standard deviation, and range. b. Using Fx (or formula) functions find the following (be sure to show the formula and not just the value in each cell) asked for salary statistics for each gender: Male Female Mean: Sample Standard Deviation Range: Develop a 5-number summary for the overall, male, and female SALARY variable. For full credit, use the excel formulas in each cell rather than simply the numerical answer. Overall Males Females Max 3rd Q Midpoint 1 st Q Min Location Measures: comparing Male and Female midpoints to the overall Salary data range. For full credit, show the excel formulas in each cell rather than simply the numerical answer. Using the entire Salary range and the M and F midpoints found in Q2 Male Female . What would each midpoint's percentile rank be in the overall range? b. What is the normal curve z value for each midpoint within overall range? Use Excel's =PERCENTRANK.EXC function Use Excel's =STANDARDIZE function Probability Measures: comparing Male and Female midpoints to the overall Salary data range For full credit, show the excel formulas in each cell rather than simply the numerical answer. Using the entire Salary range and the M and F midpoints found in Q2, find Male . The Empirical Probability of equaling or exceeding (=>) that value for Female Show the calculation formula = value/50 or =countif(range,">="&cell)/50 b. The Normal curve Prob of => that value for each group Use "=1-NORM.S.DIST" function Note: be sure to use the ENTIRE salary range for part a when finding the probability. Conclusions: What do you make of these results? Be sure to include findings from this week's lectures as well. In comparing the overall, male, and female outcomes, what relationship(s) see, to exist between the data sets? Your findings: The lecture's related findings: Overall conclusion: What does this suggest about our equal pay for equal work