Answered step by step
Verified Expert Solution
Question
1 Approved Answer
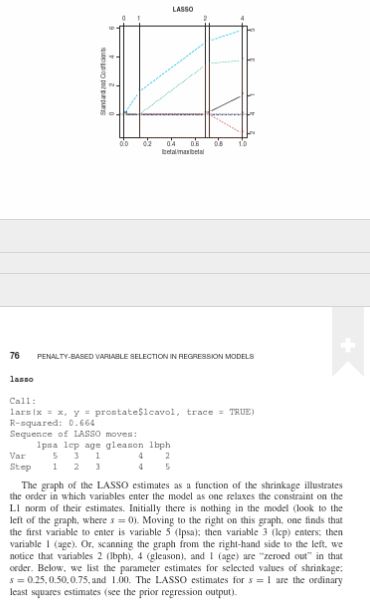
Can you hlep me understand this graph and what it means? Ca 1 1 : lars 1 x = x , y = prostate$lcavol, trace
Can you hlep me understand this graph and what it means?
Ca:
lars prostate$lcavol, trace ThUE
Rsquared: $
Sequence of LASSO moves:
pta lep age gleason lbph
The eraph of the LASSO estimates as a function of the shrinkage illutates
the ender in which variables enter the model as one relaxes the constraint on the
LI norm of their estimates. Initially there is aothing in the model look to the
Ieft of the graph, where Moving to the right on this graph, one finds that
the first variable to eater is variable Ipsa; then variable lep eaters; then
variable I age Or scanning the graph from the righthand side to the left. we
notice that variables Ibphgleason and I age are "zeroed out" in that
order. Below, we list the parameter estimates for selected values of shrinkage:
and The LASSO estimates for are the ordinary
least squares estimates see the prior regression output

Step by Step Solution
There are 3 Steps involved in it
Step: 1

Get Instant Access to Expert-Tailored Solutions
See step-by-step solutions with expert insights and AI powered tools for academic success
Step: 2

Step: 3

Ace Your Homework with AI
Get the answers you need in no time with our AI-driven, step-by-step assistance
Get Started


