

Answered step by step
Verified Expert Solution
Question
1 Approved Answer
can you please answer this and show work i will send 2 screenshots since it is a long question can you see this? can you
can you please answer this and show work 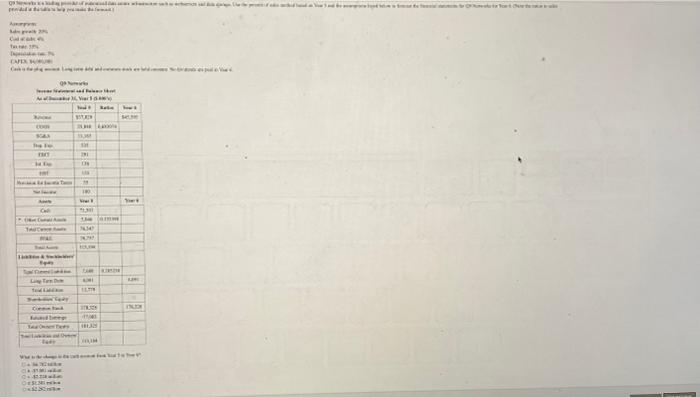
i will send 2 screenshots since it is a long question 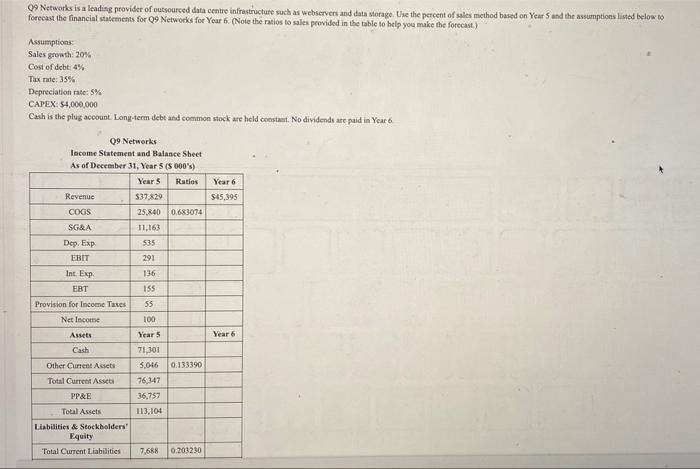
can you see this? 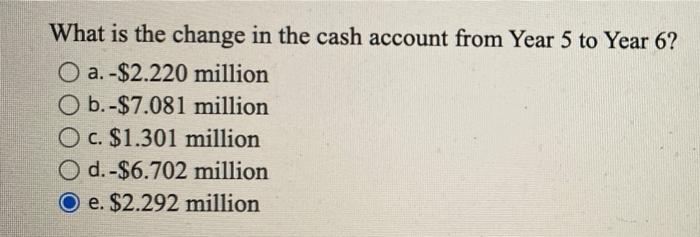
can you delete the question because i dont know why it's not clear. it looks clear to me
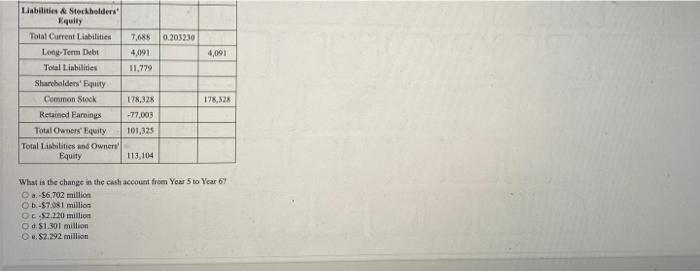
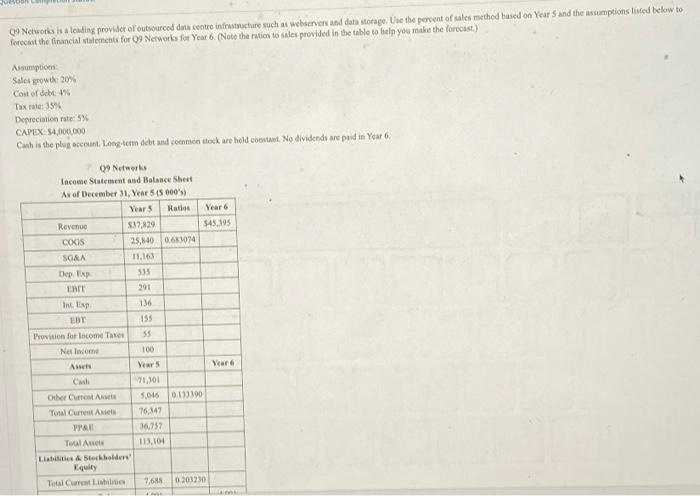
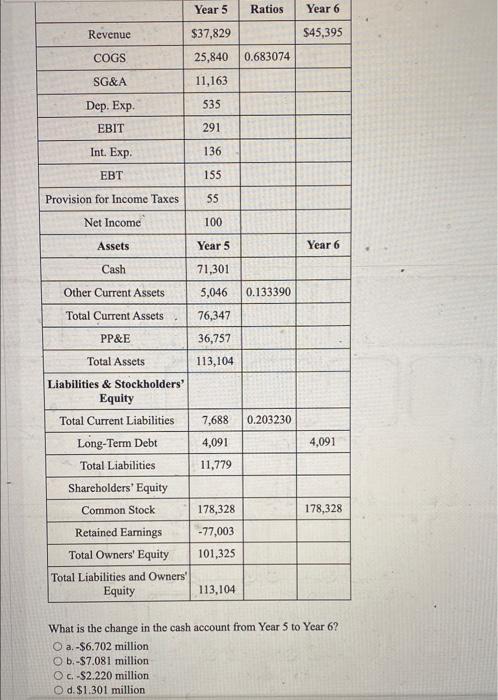
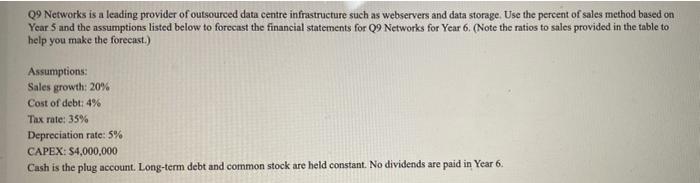
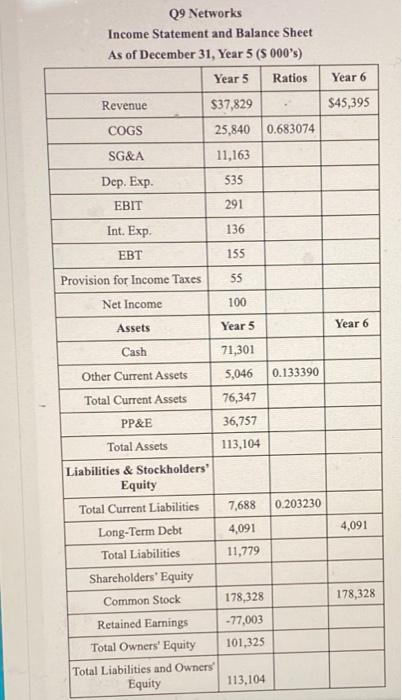
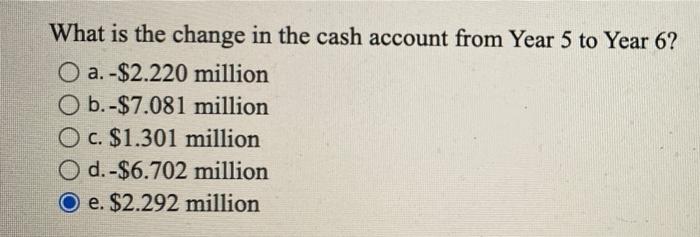
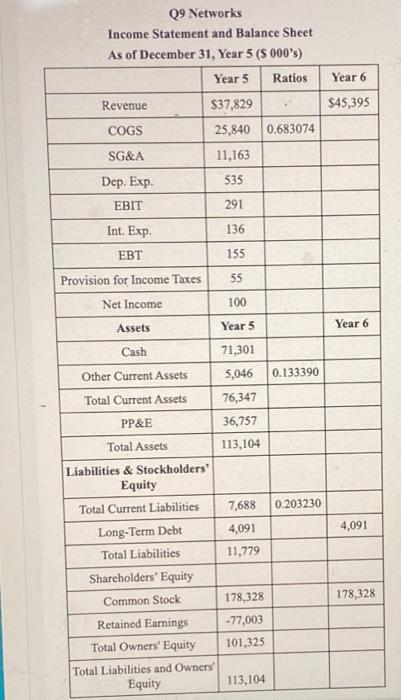
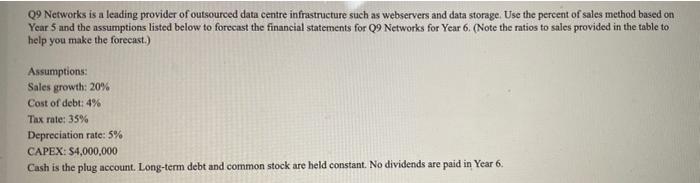
www CA . wat 103 0 1 her IND IN SEN US 09 Networks is a leading provider of outsourced data centre infrastructure such as Webservers and data orage. Use the percent of sales method based on Year 5 und the assumptions listed below to forecast the financial statements for 09 Networks for Year 6. (Note the ratios to sales provided in the table to help you make the forecast.) Assumption Sales growth: 20% Cost of debt: 4% Tax rate: 35% Depreciation rate: 5% CAPEX: 54,000,000 Cash is the plug account. Long-term debt and common stock are held constant. No dividends are paid in Year 6 Year 6 $45.395 09 Networks Income Statement and Balance Sheet As of December 31, Year 5 (000's) Years Ratios Revenue $37.829 COGS 25,840 0.683074 SG&A 11,163 Dep. 535 EBIT 291 Int. Exp 136 EBT 155 55 Provision for Income Taxes Net Income Assets Year 6 Cash 100 Years 71,301 5,046 76.347 36.757 113,104 Other Current Assets Total Current Asset PP&E Total Assets Liabilities & Stockholders' Equity Total Current Liabilities 0.133390 7,688 0.203230 0,203230 7,685 4,091 11.779 4,091 Liabilities Stockholders Equity Total Current Liabilities Long Term Debt Total Liabilities Shareholders' Equity Common Stock Retained Earnings Total Owners' Equity Total Liabilities and Owners Equity 178.328 178,328 -77,003 101,325 113,104 What is the change in the cash account from Year 5 to Year 67 a $6.702 million Ob-$7.081 million $2.220 million Od: $1,301 million S2.292 million 09 Networks is a leading provider of outsourced data centre instructure such a webservers and data storage. Use the perront of sales method used on Year S and the assumptions listed below to forecast the financial statements for 09 Networks for Year 6. (Note the nation to sales provided in the table to help you make the forecast) Assumption Sales growth 20% Cost of debt: 4% Tax : 33% Depreciation rates CAPEX $4,000,000 Cash is the plug account, Long-term debt and common stock are held constant. No dividends are paid in Year 6. Year 545,195 9 Networks Income Statement and Balance Sheet As of December 31, Year 5 (5000) Years Ratis Revenue 537.829 cogs 25,840 0.61074 SORA 11,165 Depp 535 ERTE 291 Int. Exp EBT Provision for Income Taxe Netcome Year 155 35 100 Vears 71.301 5.046 76.347 16.757 115,104 Casil Other Current A Total Current A PPAL Total Auto Latte & Stebolders quity Total Care Liste 0.033100 7.688 0203230 Year 5 Ratios Year 6 Revenue $37,829 $45,395 COGS 25,840 0.683074 11,163 SG&A 535 Dep, Exp, EBIT 291 Int. Exp. 136 155 Provision for Income Taxes 55 Net Income 100 Assets Year 5 Year 6 Cash 71,301 5,046 Other Current Assets 0.133390 Total Current Assets 76,347 36,757 113,104 0.203230 PP&E Total Assets Liabilities & Stockholders' Equity Total Current Liabilities Long-Term Debt Total Liabilities Shareholders' Equity Common Stock Retained Earnings Total Owners' Equity Total Liabilities and Owners' Equity 7,688 4,091 11,779 4,091 178,328 178,328 -77,003 101,325 113,104 What is the change in the cash account from Year 5 to Year 6? O a. -$6.702 million O b.-$7.081 million OC-S2.220 million Od. $1.301 million 09 Networks is a leading provider of outsourced data centre infrastructure such as webservers and data storage. Use the percent of sales method based on Year 5 and the assumptions listed below to forecast the financial statements for Q9 Networks for Year 6. (Note the ratios to sales provided in the table to help you make the forecast.) Assumptions Sales growth: 20% Cost of debt: 4% Tax rate: 35% Depreciation rate: 5% CAPEX: $4,000,000 Cash is the plug account. Long-term debt and common stock are held constant. No dividends are paid in Year 6. Year 6 Q9 Networks Income Statement and Balance Sheet As of December 31, Year 5 ($ 000's) Year 5 Ratios Revenue $37,829 COGS 25,840 0.683074 SG&A 11,163 Dep. Exp. 535 EBIT 291 $45,395 Int. Exp. 136 EBT 155 55 Provision for Income Taxes Net Income 100 Assets Year 5 Year 6 Cash Other Current Assets 0.133390 Total Current Assets 71,301 5,046 76,347 36,757 113,104 PP&E Total Assets 7,688 0.203230 4,091 4,091 11,779 Liabilities & Stockholders Equity Total Current Liabilities Long-Term Debt Total Liabilities Shareholders' Equity Common Stock Retained Earnings Total Owners' Equity Total Liabilities and Owners Equity 178,328 178,328 -77,003 101,325 113,104 What is the change in the cash account from Year 5 to Year 6? O a.-$2.220 million O b.-$7.081 million O c. $1.301 million O d. -$6.702 million O e. $2.292 million What is the change in the cash account from Year 5 to Year 6? O a. -$2.220 million O b.-$7.081 million O c. $1.301 million O d.-$6.702 million O e. $2.292 million Year 6 Q9 Networks Income Statement and Balance Sheet As of December 31, Year 5 ($ 000's) Year 5 Ratios Revenue $37,829 COGS 25,840 0.683074 SG&A 11,163 Dep. Exp. 535 $45,395 EBIT 291 Int. Exp. 136 EBT 155 55 Provision for Income Taxes Net Income 100 Assets Year 5 Year 6 Cash Other Current Assets 0.133390 Total Current Assets 71,301 5,046 76,347 36,757 113,104 PP&E Total Assets 0.203230 7,688 4,091 11,779 4,091 Liabilities & Stockholders' Equity Total Current Liabilities Long-Term Debt Total Liabilities Shareholders' Equity Common Stock Retained Earnings Total Owners' Equity Total Liabilities and Owners Equity 178,328 178,328 -77,003 101,325 113,104 09 Networks is a leading provider of outsourced data centre infrastructure such as webservers and data storage. Use the percent of sales method based on Year 5 and the assumptions listed below to forecast the financial statements for Q9 Networks for Year 6. (Note the ratios to sales provided in the table to help you make the forecast.) Assumptions: Sales growth: 20% Cost of debt: 4% Tax rate: 35% Depreciation rate: 5% CAPEX: $4,000,000 Cash is the plug account. Long-term debt and common stock are held constant. No dividends are paid in Year 6. www CA . wat 103 0 1 her IND IN SEN US 09 Networks is a leading provider of outsourced data centre infrastructure such as Webservers and data orage. Use the percent of sales method based on Year 5 und the assumptions listed below to forecast the financial statements for 09 Networks for Year 6. (Note the ratios to sales provided in the table to help you make the forecast.) Assumption Sales growth: 20% Cost of debt: 4% Tax rate: 35% Depreciation rate: 5% CAPEX: 54,000,000 Cash is the plug account. Long-term debt and common stock are held constant. No dividends are paid in Year 6 Year 6 $45.395 09 Networks Income Statement and Balance Sheet As of December 31, Year 5 (000's) Years Ratios Revenue $37.829 COGS 25,840 0.683074 SG&A 11,163 Dep. 535 EBIT 291 Int. Exp 136 EBT 155 55 Provision for Income Taxes Net Income Assets Year 6 Cash 100 Years 71,301 5,046 76.347 36.757 113,104 Other Current Assets Total Current Asset PP&E Total Assets Liabilities & Stockholders' Equity Total Current Liabilities 0.133390 7,688 0.203230 0,203230 7,685 4,091 11.779 4,091 Liabilities Stockholders Equity Total Current Liabilities Long Term Debt Total Liabilities Shareholders' Equity Common Stock Retained Earnings Total Owners' Equity Total Liabilities and Owners Equity 178.328 178,328 -77,003 101,325 113,104 What is the change in the cash account from Year 5 to Year 67 a $6.702 million Ob-$7.081 million $2.220 million Od: $1,301 million S2.292 million 09 Networks is a leading provider of outsourced data centre instructure such a webservers and data storage. Use the perront of sales method used on Year S and the assumptions listed below to forecast the financial statements for 09 Networks for Year 6. (Note the nation to sales provided in the table to help you make the forecast) Assumption Sales growth 20% Cost of debt: 4% Tax : 33% Depreciation rates CAPEX $4,000,000 Cash is the plug account, Long-term debt and common stock are held constant. No dividends are paid in Year 6. Year 545,195 9 Networks Income Statement and Balance Sheet As of December 31, Year 5 (5000) Years Ratis Revenue 537.829 cogs 25,840 0.61074 SORA 11,165 Depp 535 ERTE 291 Int. Exp EBT Provision for Income Taxe Netcome Year 155 35 100 Vears 71.301 5.046 76.347 16.757 115,104 Casil Other Current A Total Current A PPAL Total Auto Latte & Stebolders quity Total Care Liste 0.033100 7.688 0203230 Year 5 Ratios Year 6 Revenue $37,829 $45,395 COGS 25,840 0.683074 11,163 SG&A 535 Dep, Exp, EBIT 291 Int. Exp. 136 155 Provision for Income Taxes 55 Net Income 100 Assets Year 5 Year 6 Cash 71,301 5,046 Other Current Assets 0.133390 Total Current Assets 76,347 36,757 113,104 0.203230 PP&E Total Assets Liabilities & Stockholders' Equity Total Current Liabilities Long-Term Debt Total Liabilities Shareholders' Equity Common Stock Retained Earnings Total Owners' Equity Total Liabilities and Owners' Equity 7,688 4,091 11,779 4,091 178,328 178,328 -77,003 101,325 113,104 What is the change in the cash account from Year 5 to Year 6? O a. -$6.702 million O b.-$7.081 million OC-S2.220 million Od. $1.301 million 09 Networks is a leading provider of outsourced data centre infrastructure such as webservers and data storage. Use the percent of sales method based on Year 5 and the assumptions listed below to forecast the financial statements for Q9 Networks for Year 6. (Note the ratios to sales provided in the table to help you make the forecast.) Assumptions Sales growth: 20% Cost of debt: 4% Tax rate: 35% Depreciation rate: 5% CAPEX: $4,000,000 Cash is the plug account. Long-term debt and common stock are held constant. No dividends are paid in Year 6. Year 6 Q9 Networks Income Statement and Balance Sheet As of December 31, Year 5 ($ 000's) Year 5 Ratios Revenue $37,829 COGS 25,840 0.683074 SG&A 11,163 Dep. Exp. 535 EBIT 291 $45,395 Int. Exp. 136 EBT 155 55 Provision for Income Taxes Net Income 100 Assets Year 5 Year 6 Cash Other Current Assets 0.133390 Total Current Assets 71,301 5,046 76,347 36,757 113,104 PP&E Total Assets 7,688 0.203230 4,091 4,091 11,779 Liabilities & Stockholders Equity Total Current Liabilities Long-Term Debt Total Liabilities Shareholders' Equity Common Stock Retained Earnings Total Owners' Equity Total Liabilities and Owners Equity 178,328 178,328 -77,003 101,325 113,104 What is the change in the cash account from Year 5 to Year 6? O a.-$2.220 million O b.-$7.081 million O c. $1.301 million O d. -$6.702 million O e. $2.292 million What is the change in the cash account from Year 5 to Year 6? O a. -$2.220 million O b.-$7.081 million O c. $1.301 million O d.-$6.702 million O e. $2.292 million Year 6 Q9 Networks Income Statement and Balance Sheet As of December 31, Year 5 ($ 000's) Year 5 Ratios Revenue $37,829 COGS 25,840 0.683074 SG&A 11,163 Dep. Exp. 535 $45,395 EBIT 291 Int. Exp. 136 EBT 155 55 Provision for Income Taxes Net Income 100 Assets Year 5 Year 6 Cash Other Current Assets 0.133390 Total Current Assets 71,301 5,046 76,347 36,757 113,104 PP&E Total Assets 0.203230 7,688 4,091 11,779 4,091 Liabilities & Stockholders' Equity Total Current Liabilities Long-Term Debt Total Liabilities Shareholders' Equity Common Stock Retained Earnings Total Owners' Equity Total Liabilities and Owners Equity 178,328 178,328 -77,003 101,325 113,104 09 Networks is a leading provider of outsourced data centre infrastructure such as webservers and data storage. Use the percent of sales method based on Year 5 and the assumptions listed below to forecast the financial statements for Q9 Networks for Year 6. (Note the ratios to sales provided in the table to help you make the forecast.) Assumptions: Sales growth: 20% Cost of debt: 4% Tax rate: 35% Depreciation rate: 5% CAPEX: $4,000,000 Cash is the plug account. Long-term debt and common stock are held constant. No dividends are paid in Year 6 Step by Step Solution
There are 3 Steps involved in it
Step: 1

Get Instant Access to Expert-Tailored Solutions
See step-by-step solutions with expert insights and AI powered tools for academic success
Step: 2

Step: 3
Ace Your Homework with AI
Get the answers you need in no time with our AI-driven, step-by-step assistance
Get Started
The Nonprofit Fundraising Solution Powerful Revenue Strategies To Take You To The Next Level
Authors: Laurence Pagnoni , Michael Solomon
1st Edition
0814432964,0814432972