

Answered step by step
Verified Expert Solution
Question
1 Approved Answer
Can you please Apply the steps in MATlab, and show me the a picture of how did you apply the code in MATlab. Load the
Can you please Apply the steps in MATlab, and show me the a picture of how did you apply the code in MATlab. 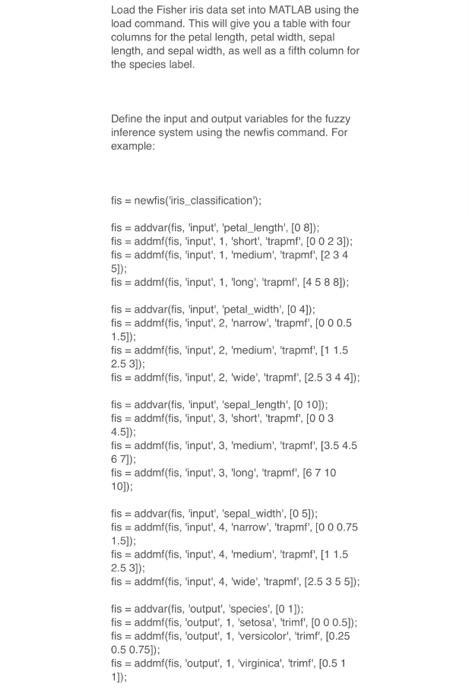
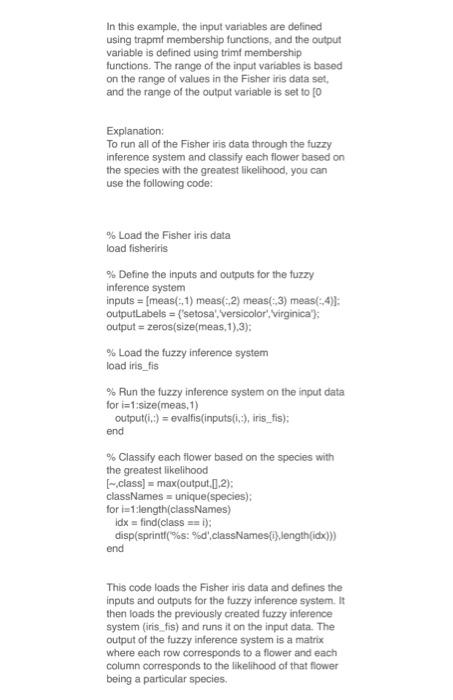
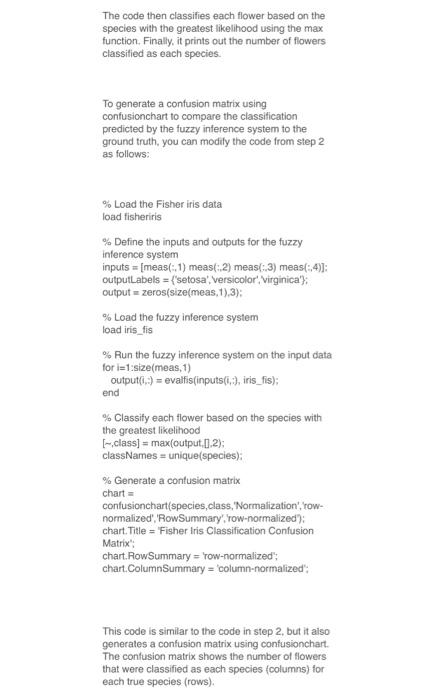
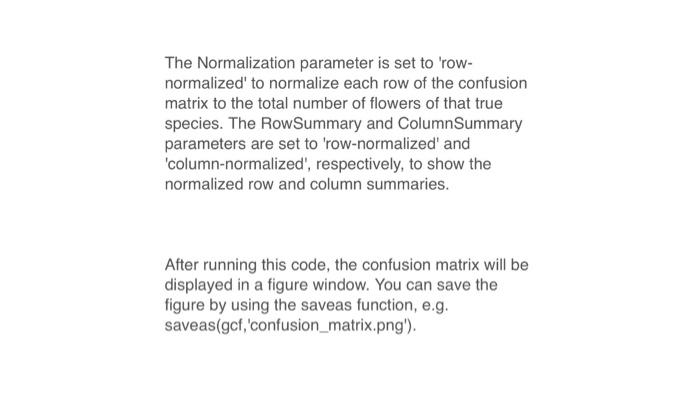
Load the Fisher iris data set into MATLAB using the load command. This will give you a table with four columns for the petal length, petal width, sepal length, and sepal width, as well as a fitth column for the species label. Define the input and output variables for the fuzzy inference system using the newfis command. For example: fis = newfis('iris_classification'): fis = addvar(fis, 'input', 'petal_length', [0 8]); fis = addmt(fis, 'input', 1, 'medium', 'trapmf', [2 34 5]); fis = addmf(fis,input,1,long,trapmf,[4588 8]): fis = addvar(fis, 'input', 'petal_width', [0 4 4 ] ); fis =addm (fis, 'input', 2, 'narrow', 'trapmf', [0 00.5 1+5]); fis = addmf(fis, 'input', 2, 'medium', 'trapme', [1 1.5 2.53l); fis = addmf(fis, 'input', 2, 'wide', 'trapmf', [2.5 34 4 4 ] ): fis = addvar(fis, 'input', 'sepal_length', [0 10]); fis = addmf(fis, 'input', 3, 'short', 'trapmf', [0 03 4.5]); fis = addmf(fis, 'input', 3, 'medium', 'trapmt', [3.5 4.5 6.7]); fis = addmf(fis, 'input', 3, 'long', 'trapmf', [6710 10]j; fis = addvar(fis, 'input', 'sepal_width', [0 5]); fis = addmf(fis, 'input', 4, 'narrow', 'trapmf', [0 00.75 1.5]); fis = addmf(fis, 'input', 4, 'medium', 'trapmf', [1 1.5 2.53];i fis = addmf(fis, 'input', 4, wide', 'trapmf', [2.5 35 5)); fis = addvar(fis, 'output', 'species', [01]]; fis = addmf(fis, 'output', 1, 'setosa', 'trimf', [ 000.5]); fis = addm'(fis, 'output', 1, 'versicolor', 'trimf', [0.25 0.50.75] ); fis = addmf(fis, 'output', 1, virginica', 'trimf', [0.51 11): In this example, the input variables are delined using trapmi membership functions, and the output variable is defined using trimf membership functions. The range of the input variables is based on the range of values in the Fisher iris data set. and the range of the output variable is set to 00 Explanation: To run all of the Fisher iris data through the fuzzy inference system and classify each flower based on the species with the greatest likelihood, you can use the following code: \% Load the Fisher inis data load fisheriris % Define the inputs and outputs for the tuzzy inference system inputs =[meas(,1) meas (2) meas (,3) meas (4)]= outputLabels = { setosa', versicolor', virginica' }; output = zeros (size(meas,1),3) : % Load the fuzzy inference system load iris_fis % Run the fuzzy interence system on the input data for i=1:size(meas, 1) output (i1,)= evalfis(inputs(i,i), iris_fis); end \% Classify each flower based on the species with the greatest likelihood [, class ]= max(output, [,2 ); classNames = unique(species); for i=1:length(classNames) id x= find (class =i); disp(sprintf(\%)s: \%od', classNames(t),length(idx))) end This code loads the Fisher iris data and defines the inputs and outputs for the fuzzy inference system. It then loads the previously created fuzzy inference system (iris_fis) and runs it on the input data. The output of the fuzzy inference system is a matrix where each row corresponds to a flower and each column corresponds to the likelihood of that flower being a particular species. The code then classifies each flower based on the species with the greatest likelihood using the max function. Finally, it prints out the number of flowers classified as each species. To generate a confusion matrix using confusionchart to compare the classitication predicted by the fuzzy inference system to the ground truth. you can modily the code from step 2 as follows: \% Load the Fisher iris data load fisheriris \% Define the inputs and outputs for the fuzzy inference system inputs = [meas(:,1) meas (2) meas (;3) meas (:4)]; outputLabels ={ 'setosa', versicolor', 'virginica' }; output = zeros(size ( meas, 1),3); % Load the fuzzy inference system load iris_fis % Run the fuzzy inference system on the input data for i=1:size(meas, 1) output (i,)=evalfis(inputs (i,i), iris_fis); end \% Classify each flower based on the species with the greatest likelihood [, class ]=max( output, [,2); classNames = unique(species): \% Generate a contusion matrix chart = confusionchart(species, class, 'Normalization', 'rownormalized', 'RowSummary', 'row-normalized'); chart. Title = 'Figher Iris Classification Confusion Matrix: chart.RowSummary = 'row-normalized"; chart. ColumnSummary = 'column-normalized'; This code is similar to the code in step 2, but it also generates a confusion matrix using confusionchart. The confusion matrix shows the number of flowers that were classified as each species (columns) for each true species (rows). The Normalization parameter is set to 'rownormalized' to normalize each row of the confusion matrix to the total number of flowers of that true species. The RowSummary and ColumnSummary parameters are set to 'row-normalized' and 'column-normalized', respectively, to show the normalized row and column summaries. After running this code, the confusion matrix will be displayed in a figure window. You can save the figure by using the saveas function, e.g. saveas(gcf,'confusion_matrix.png') Step by Step Solution
There are 3 Steps involved in it
Step: 1

Get Instant Access to Expert-Tailored Solutions
See step-by-step solutions with expert insights and AI powered tools for academic success
Step: 2

Step: 3
Ace Your Homework with AI
Get the answers you need in no time with our AI-driven, step-by-step assistance
Get Started
Fundamentals Of Database Management Systems
Authors: Mark L. Gillenson
3rd Edition
978-1119907466