can you please check my work
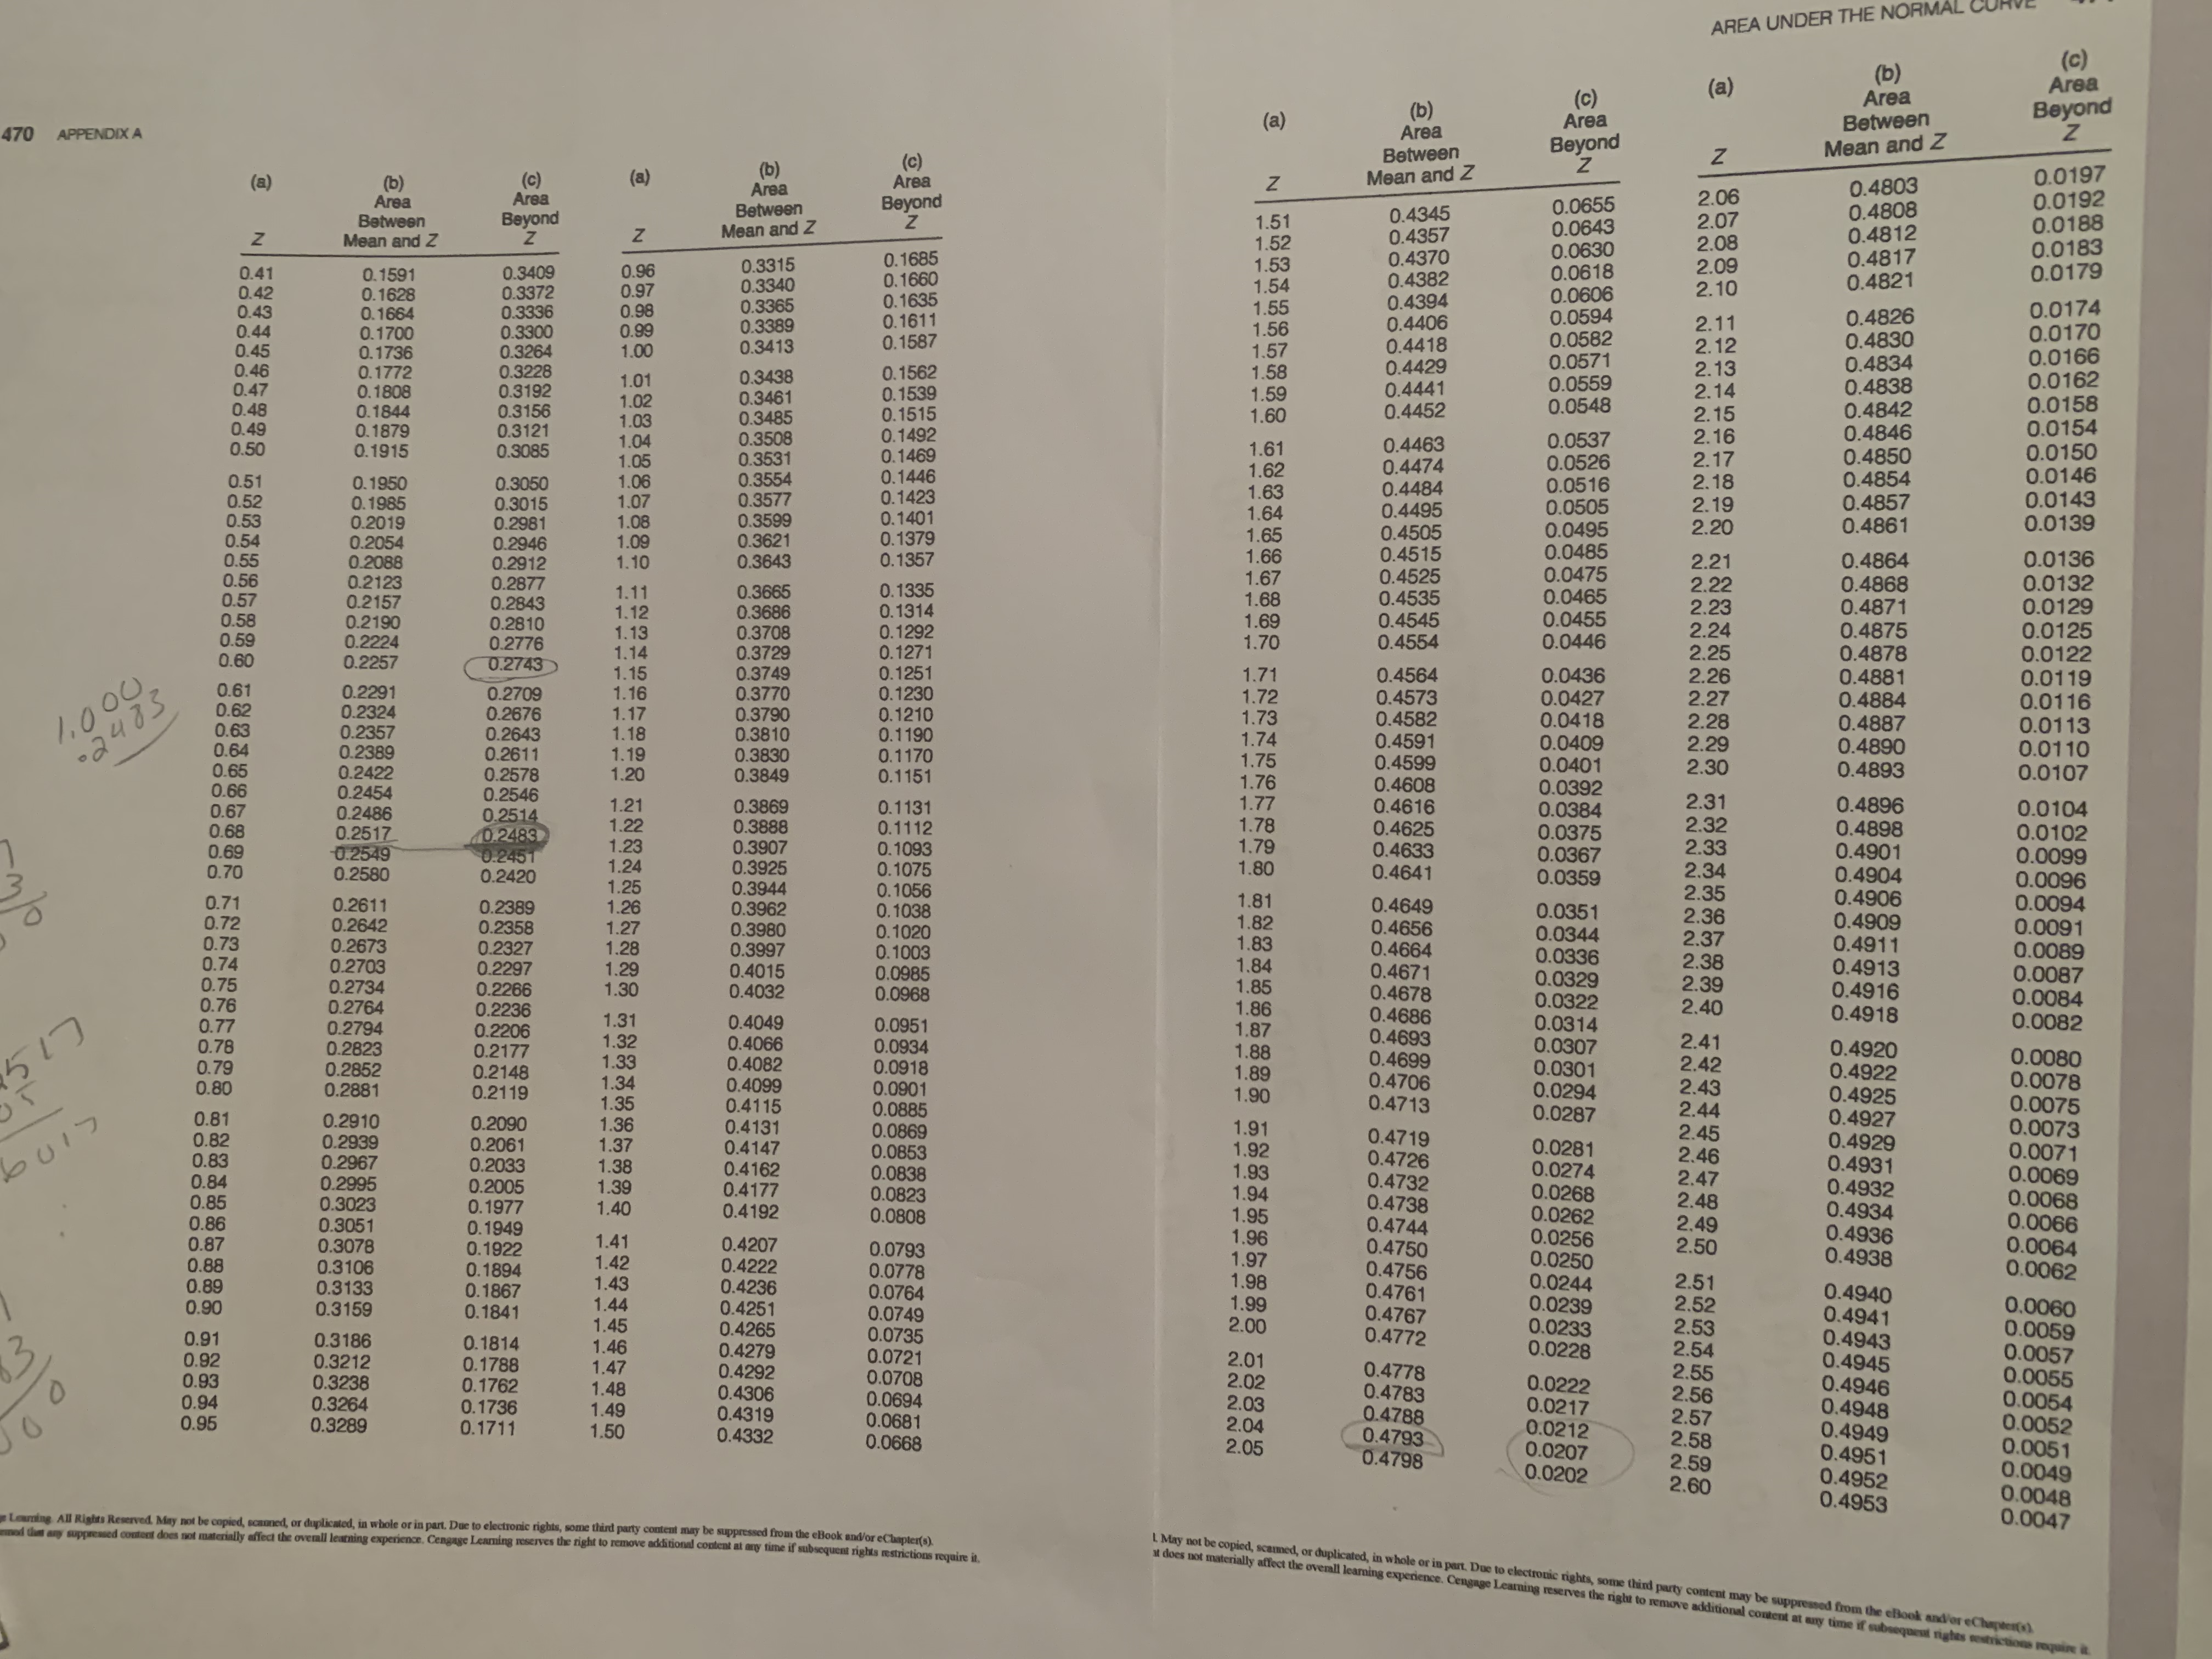
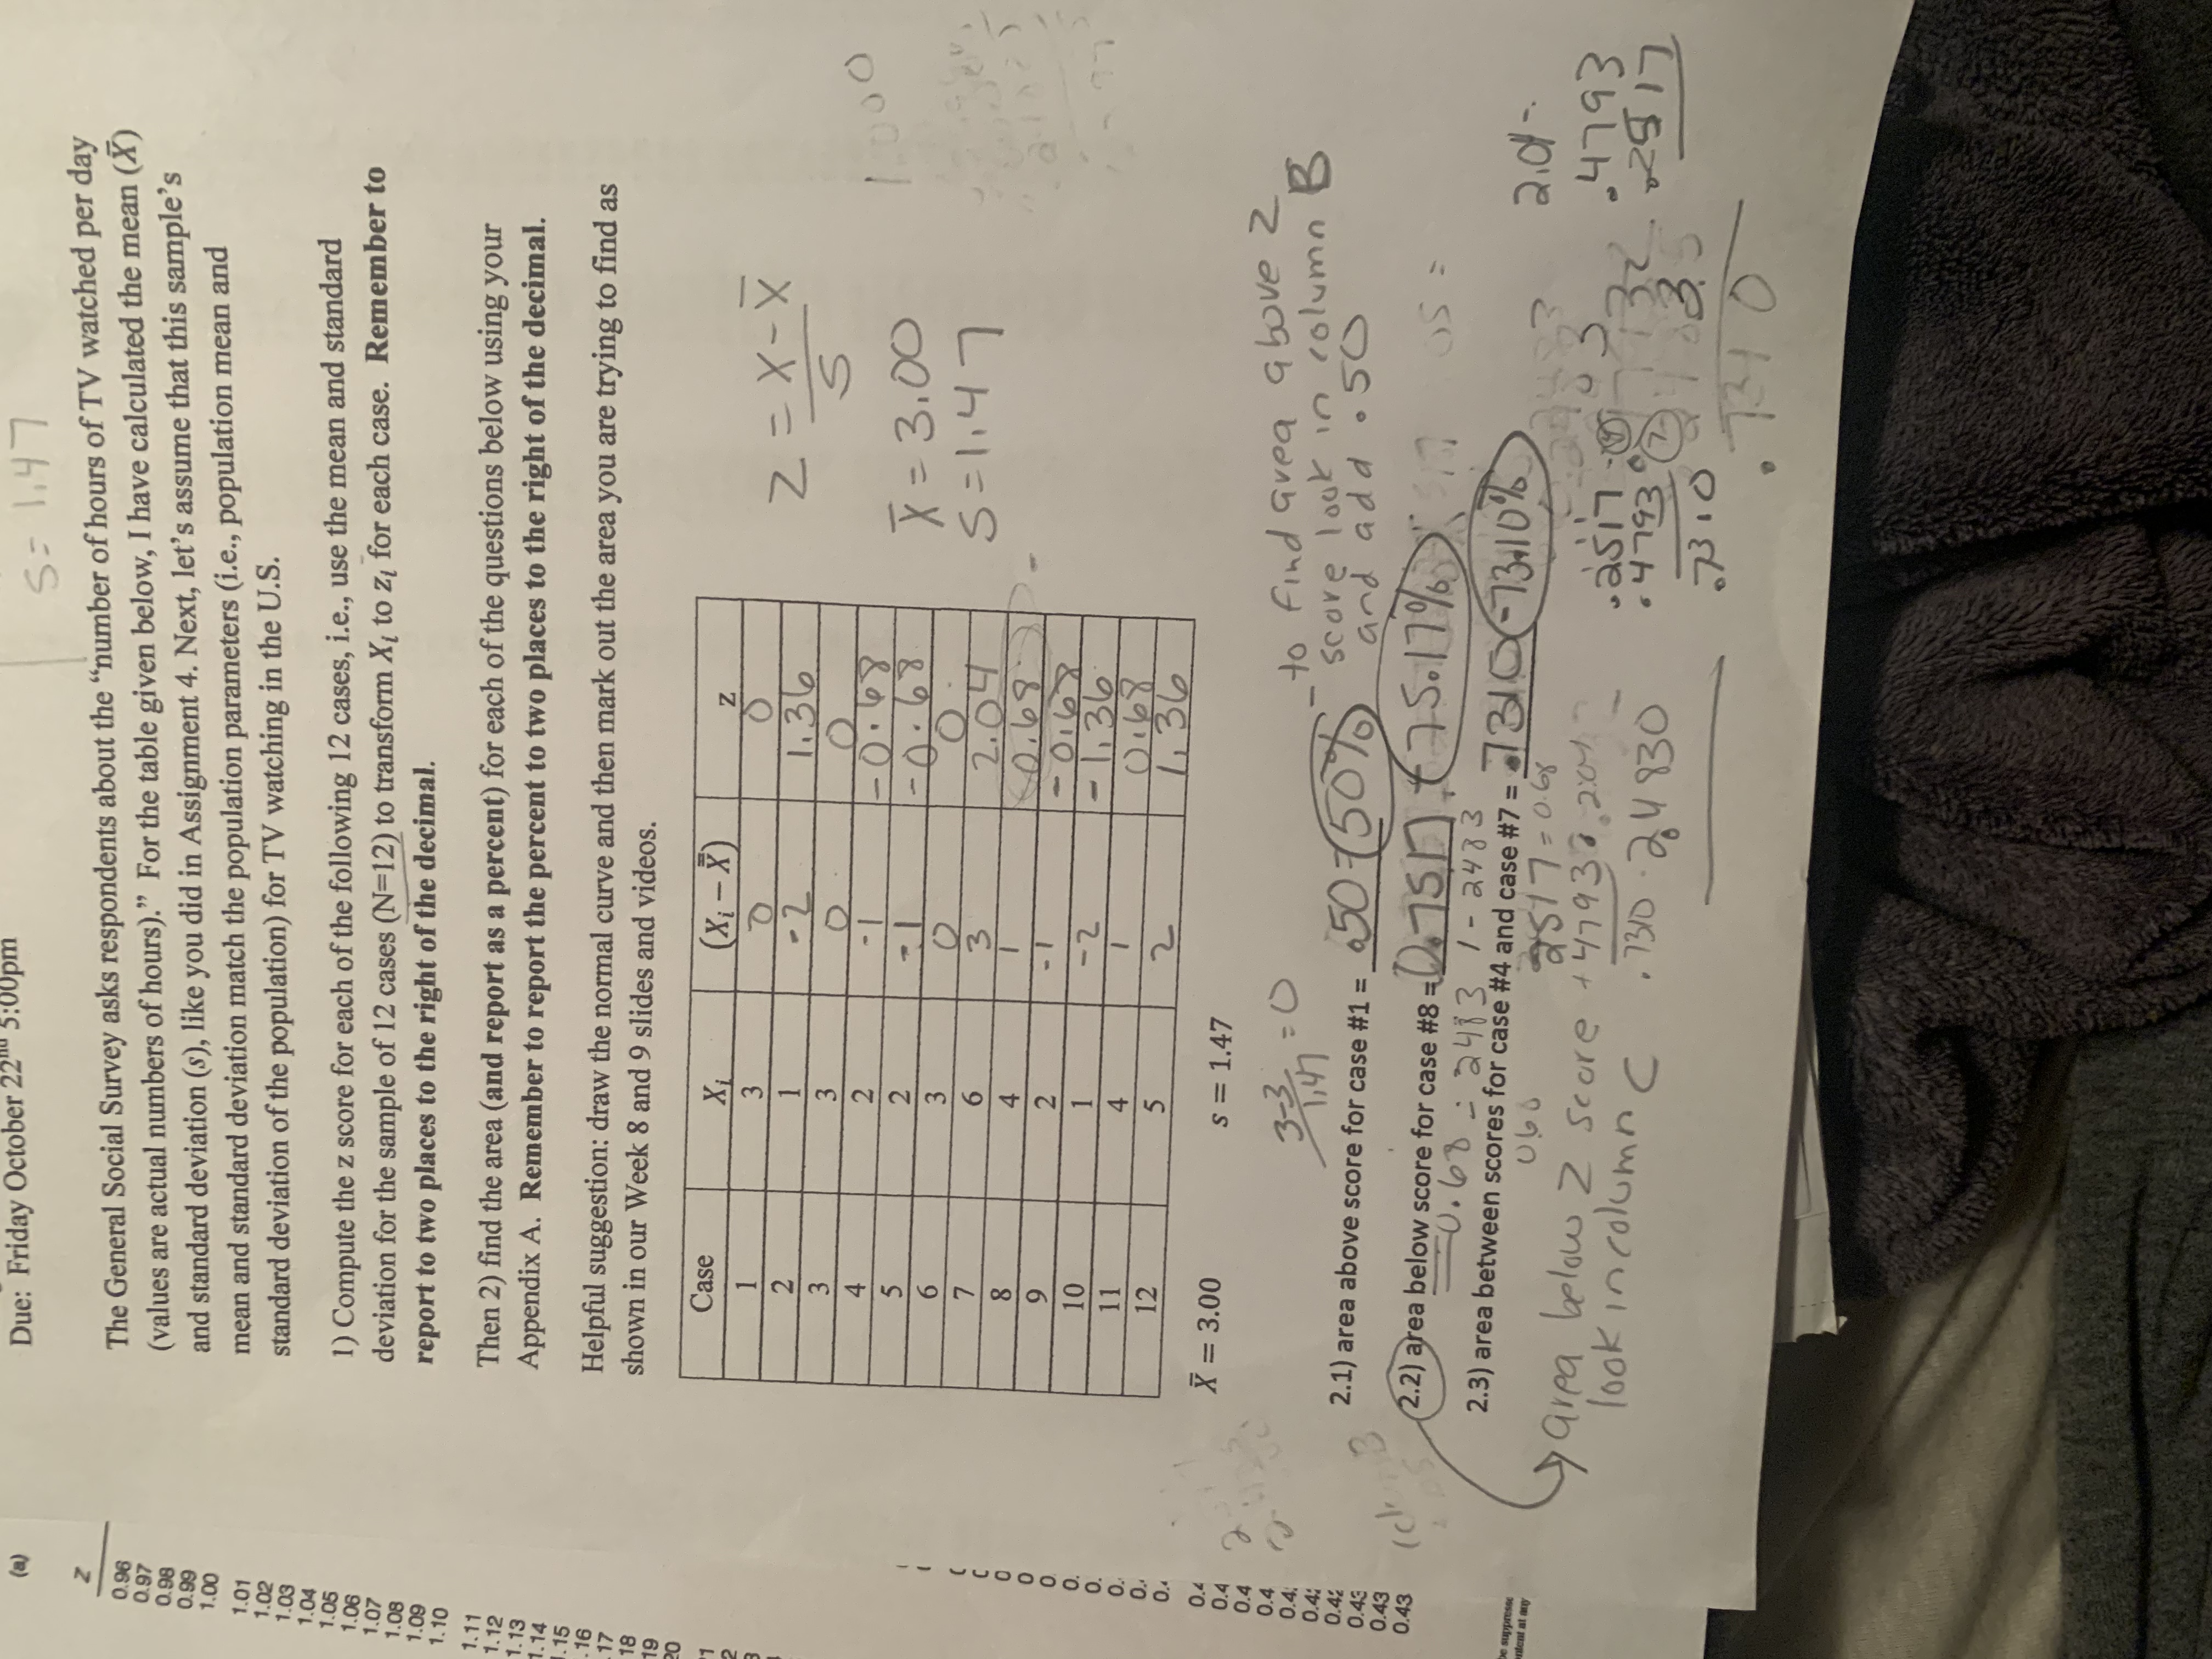
AREA UNDER TH (b) (c) Area (C) Area (b) Beyond 470 APPENDIX A Area Area Between Beyond Mean and Z (C ) (D) (c) Between N (b) 0.0197 Area Area Mean and Z N Area Beyond 2.06 0.4803 Beyond Between 0.4345 0.0655 2.07 0.4808 0.0192 Between 1.51 1.52 0.4357 0.0643 Z Mean and Z 2 Mean and Z 0.0630 2.08 0.4812 0.0188 0.3409 0.3315 0.1685 1.53 0.4370 0.0618 2.09 0.4817 0.0183 0.41 0. 1591 0.96 0.42 0.3372 0.97 0.3340 0. 1660 1.54 0.4382 0.0179 0.1628 0.98 0. 1635 2.10 0.4821 0.43 0. 1664 0.3336 0.3365 1.55 0.4394 0.0606 0. 1611 0.0594 0.4826 0.0174 0.44 0.1700 0.3300 0.99 0.3389 0.1587 1.56 0.4406 2.11 0.45 0. 1736 0.3413 0.0170 0.3264 1.00 1.57 0.4418 0.0582 2.12 0.4830 0.0166 0.46 0.1772 .3228 1.58 0.4429 0.0571 0.47 0.1808 .3192 1.01 0.3438 0. 1562 2.13 0.4834 0.346 0. 1539 0.0162 1.02 1.59 0.4441 0.0559 2.14 0.4838 0.48 0.1844 0.3156 0.0548 0.0158 0.49 0. 1879 0.3121 1.03 0.3485 0.1515 1.60 0.4452 2.15 0.4842 0.1492 0.50 0.1915 0.3085 1.04 0.3508 1.61 0.4463 0.0537 2 .16 0.4846 0.0154 1.05 0.3531 . 1469 0.0526 2.17 0.4850 0.0150 0.51 0. 1950 0.3050 1.06 0.3554 . 1446 1.62 0.4474 0.4854 0.0146 0.52 0. 1985 0.3015 1.07 0.3577 0.1423 1.63 0.4484 0.0516 2.18 1.64 0.4495 0.0505 2.19 0.4857 0.0143 0.53 0.2019 0.2981 1.08 0.3599 0. 1401 2.20 0.4861 0.0139 0.54 0.2054 0.2946 1.09 0.3621 0. 1379 1.65 0.4505 0.0495 0.55 0.2088 0.2912 1.10 0.3643 0.1357 1.66 0.4515 0.0485 2.21 0.4864 0.0136 0.56 0.2123 0.2877 1.67 0.4525 0.0475 0.57 0.3665 0. 1335 0.4535 2.22 0.4868 0.0132 0.2157 0.2843 1.11 1.68 0.0465 0.0129 0.58 2.23 0.4871 0.2190 0.2810 1.12 0.3686 0. 1314 1.69 0.4545 0.59 0.2776 1.13 0.3708 0. 1292 0.0455 0.2224 1.14 0.3729 0.1271 1.70 0.4554 0.0446 2.24 0.4875 0.0125 0.60 0.2257 0.2743 2.25 0.4878 0.0122 1.15 0.3749 0. 1251 1.71 0.4564 0.0436 2.26 0.61 0.4881 0.0119 0.2291 1.000 0.2709 1.16 0.3770 0. 1230 1.72 0.62 0.4573 0.2324 0.0427 2.27 0.4884 0.2676 0.3790 0.1210 0.0116 2485 1.73 0.63 0.2357 0.4582 0.2643 1.18 0.3810 0.1190 0.0418 2.28 0.4887 0.0113 1.74 0.64 0.2389 0.2611 0.3830 0.4591 0.0409 2.29 1.19 0.1170 0.4890 0.0110 0.65 0.2422 1.75 0.2578 1.20 0.3849 0.1151 0.4599 0.0401 2.30 0.4893 0.0107 0.66 0.2454 0.2546 1.76 0.4608 0.0392 0.67 0.2486 1.77 2.31 0.2514 1.21 .3869 0.113 0.4616 0.0384 0.4896 0.0104 0.68 0.2517 0.2483 1.22 .3888 0. 1112 1.78 0.4625 0.0375 2.32 0.4898 0.0102 0.69 0.2549 12451 1.23 0.3907 0. 1093 1.79 0.4633 0.0367 2.33 0.490 0.70 0.0099 0.2580 0.2420 1.24 .3925 0.1075 1.80 0.4641 2.34 1.25 0.3944 0. 1056 0.0359 0.4904 0.0096 0.71 0.2611 2.35 0.2389 1.26 0.3962 0.4649 0.4906 0.0094 0.2642 0. 1038 1.81 0.72 0.0351 0.2358 1.27 2.36 0.3980 0.73 0. 102 1.82 0.4656 0.4909 0.0091 0.2673 0.2327 1.28 0.3997 . 1003 1.83 0.0344 0.4664 2.37 0.0089 0.74 0.2703 0.0336 0.4911 0.2297 1.29 0.4015 0.75 0.0985 1.84 0.4671 2.38 0.2266 1.30 0.4032 1.85 0.0329 0.4913 0.2734 0.0087 0.4678 0.76 0.0968 2.39 0.4916 0.2764 0.2236 1.86 0.0322 2.40 0.0084 0.77 0.2794 0.2206 1.31 0.4049 0.0951 0.4686 1.87 0.0314 0.4918 0.0082 517 0.78 0.2823 0.2177 1.32 0.4066 0.0934 0.4693 1.88 0.0307 2.41 0.4920 0.79 0.2852 0.0080 0.2148 1.33 0.4082 0.0918 0.4699 0.0301 2.42 0.80 0.2881 0.21 19 1.34 0.4099 1.89 0.4922 0.0901 0.4706 1.90 .0294 2.43 0.4925 0.0078 1.35 0.41 15 0.0885 0.4713 2.44 0.0075 0.81 0.2910 0.2090 1.36 0.82 0.4131 0.0869 1.91 0.0287 0.4927 0.2939 0.2061 1.37 1.92 0.4719 0.0281 2.45 0.4929 0.0073 0.4147 0.83 0.2967 0.2033 0.0853 0.0071 1.38 0.4162 0.84 0.0838 0.4726 0.0274 2.46 0.493 0.2995 0.2005 1.93 1.39 0.4732 2.47 0.0069 0.85 0.3023 0.4177 1.40 .0823 1.94 0.0268 0.4932 0. 1977 0.86 .4192 2.48 0.0068 0.3051 0.1949 0.0808 0.4738 1.95 0.4744 0.0262 0.0256 2.49 0.4934 0.4936 0.0066 0.87 0.3078 0.1922 1.41 0.4207 0.0793 1.96 1.97 0.4750 2.50 0.0064 0.88 0.3106 0. 1894 1.42 0.4222 0.4756 0.4938 0.0062 0.3133 0.1867 1.43 0.0778 0.0250 0.89 0.4236 1.44 0.0764 1.98 0.0244 2.51 0.90 0.3159 0.1841 0.4251 0.0749 1.99 0.4761 0.4940 1.45 0.4767 0.0239 2.52 0.4941 0.0060 0.91 0.3186 . 1814 0.4265 1.46 0.4279 0.0735 2.00 0.4772 0.0233 2.53 0.0059 0.0228 2.54 0.4943 0.92 0.3212 0.1788 1.47 0.0721 2.01 0.4945 0.0057 0.93 0.3238 0.4292 0. 1762 1.48 0.0708 2.02 0.4778 0.0222 2.55 0.4306 0.0055 0. 1736 0.0694 0.4783 2.56 0.4946 0.94 0.3264 1.49 2.03 0.4319 0.0217 0.0054 0.95 0.3289 0. 1711 1.50 0.0681 0.4788 2.57 0.4948 0.4332 2.04 0.4949 0.0052 0.0668 2.05 0.4793 0.0212 0.4798 0.0207 2.58 0.4951 0.0051 0.0202 2.59 2.60 0.4952 0.0049 0.4953 0.0048 carning. All Rights Reserved. May not be copied, scare 0.0047 than any suppressed ives the right to remove sed from the eBook and/or eChapter(s) ime if subsequent rights restrictions require it. I May not be copied, scammed, or duplicated, in whole or in part. Due to electronic rights, some third party content may be it does not materially affect the overall learning experience. Cengage Le reserves the right to remove add ased from(a) Due: Friday October 22" S= 1,47 The General Social Survey asks respondents about the "number of hours of TV watched per day 0.96 0.97 (values are actual numbers of hours)." For the table given below, I have calculated the mean (X) 0.98 0.99 and standard deviation (s), like you did in Assignment 4. Next, let's assume that this sample's 1.00 1.01 mean and standard deviation match the population parameters (i.e., population mean and 1.02 1.03 standard deviation of the population) for TV watching in the U.S. 1.04 1.05 1.06 1) Compute the z score for each of the following 12 cases, i.e., use the mean and standard 1.07 1.08 deviation for the sample of 12 cases (N=12) to transform X, to Z, for each case. Remember to 1.09 1.10 report to two places to the right of the decimal. 1.11 1.12 Then 2) find the area (and report as a percent) for each of the questions below using your 1.13 1.14 Appendix A. Remember to report the percent to two places to the right of the decimal. -16 Helpful suggestion: draw the normal curve and then mark out the area you are trying to find as shown in our Week 8 and 9 slides and videos. Case Xi - X) 1.36 2 = X- X S - 0 . PY 1000 - 0 . 68 X = 3. 00 U A - N A a W N N W - WA 2.07 S = 1,477 60.68 . ooooooon - 0168 - 1,36 0)168 136 0 . 4 0.4 X = 3.00 S = 1.47 0.4 0.4 0.4: 3- 3 = 0 to find avea above 2 0.4: 0.42 score look in column B 0.49 2.1) area above score for case #1 = 050 -( 50 7% and add . 50 0.43 0.43 2.2) area below score for case #8 =(75 {75.17% -0. 68 - 2483 1-2483 suppres 2.3) area between scores for case #4 and case #7 = _/ 31 0(-13+10% 2517 = 0.68 2.01 - area below 2 score + 47938,2:04 - 4793 look incolumn C . 7310 . 24 830 6 4793 32 25 17 7310 . 7310


