

Answered step by step
Verified Expert Solution
Question
1 Approved Answer
Can you please display the MATLAB code you used to solve this problem? 1. The calibration tests of a new pressure transducer produced the readings
Can you please display the MATLAB code you used to solve this problem?
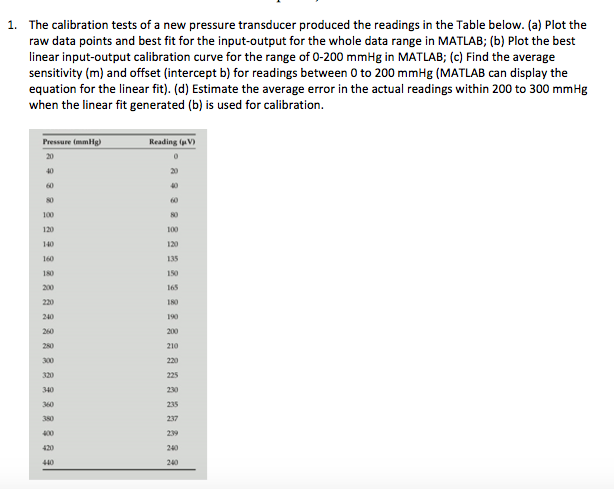
1. The calibration tests of a new pressure transducer produced the readings in the Table below. (a) Plot the raw data points and best fit for the input-output for the whole data range in MATLAB; (b) Plot the best linear input-output calibration curve for the range of 0-200 mmHg in MATLAB; (c) Find the average sensitivity (m) and offset (intercept b) for readings between 0 to 200 mmHg (MATLAB can display the equation for the linear fit). (d) Estimate the average error in the actual readings within 200 to 300 mmHg when the linear fit generated (b) is used for calibration. Pressure (mmHg) Reading ( 120 120 135 150 165 180 190 200 210 220 140 1s0 200 220 340 230 235 237 400 420 240 240Step by Step Solution
There are 3 Steps involved in it
Step: 1

Get Instant Access to Expert-Tailored Solutions
See step-by-step solutions with expert insights and AI powered tools for academic success
Step: 2

Step: 3
Ace Your Homework with AI
Get the answers you need in no time with our AI-driven, step-by-step assistance
Get Started
Privacy In Statistical Databases Unesco Chair In Data Privacy International Conference Psd 2014 Ibiza Spain September 17 19 2014 Proceedings Lncs 8744
Authors: Josep Domingo-Ferrer
2014th Edition
3319112562, 978-3319112565