

Answered step by step
Verified Expert Solution
Question
1 Approved Answer
can you please do it on excel PB10. 16.4 Use the following excerpts from Mountain Company's financial information to pre statement of cash flows (indirect
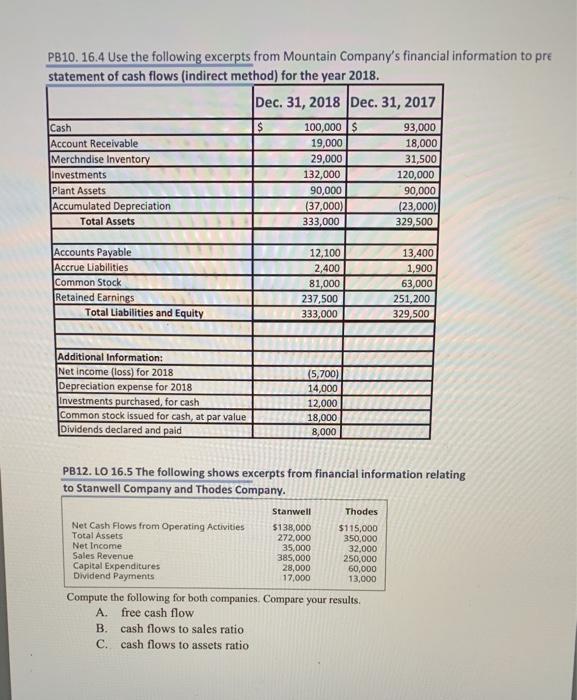
can you please do it on excel
Step by Step Solution
There are 3 Steps involved in it
Step: 1

Get Instant Access to Expert-Tailored Solutions
See step-by-step solutions with expert insights and AI powered tools for academic success
Step: 2

Step: 3
Ace Your Homework with AI
Get the answers you need in no time with our AI-driven, step-by-step assistance
Get Started
Lessons Of A Top Producer The Financial Advisors Playbook For The Million Dollar Year
Authors: Don Watson
1st Edition
1939237289, 978-1939237286