Answered step by step
Verified Expert Solution
Link Copied!

Question

1 Approved Answer

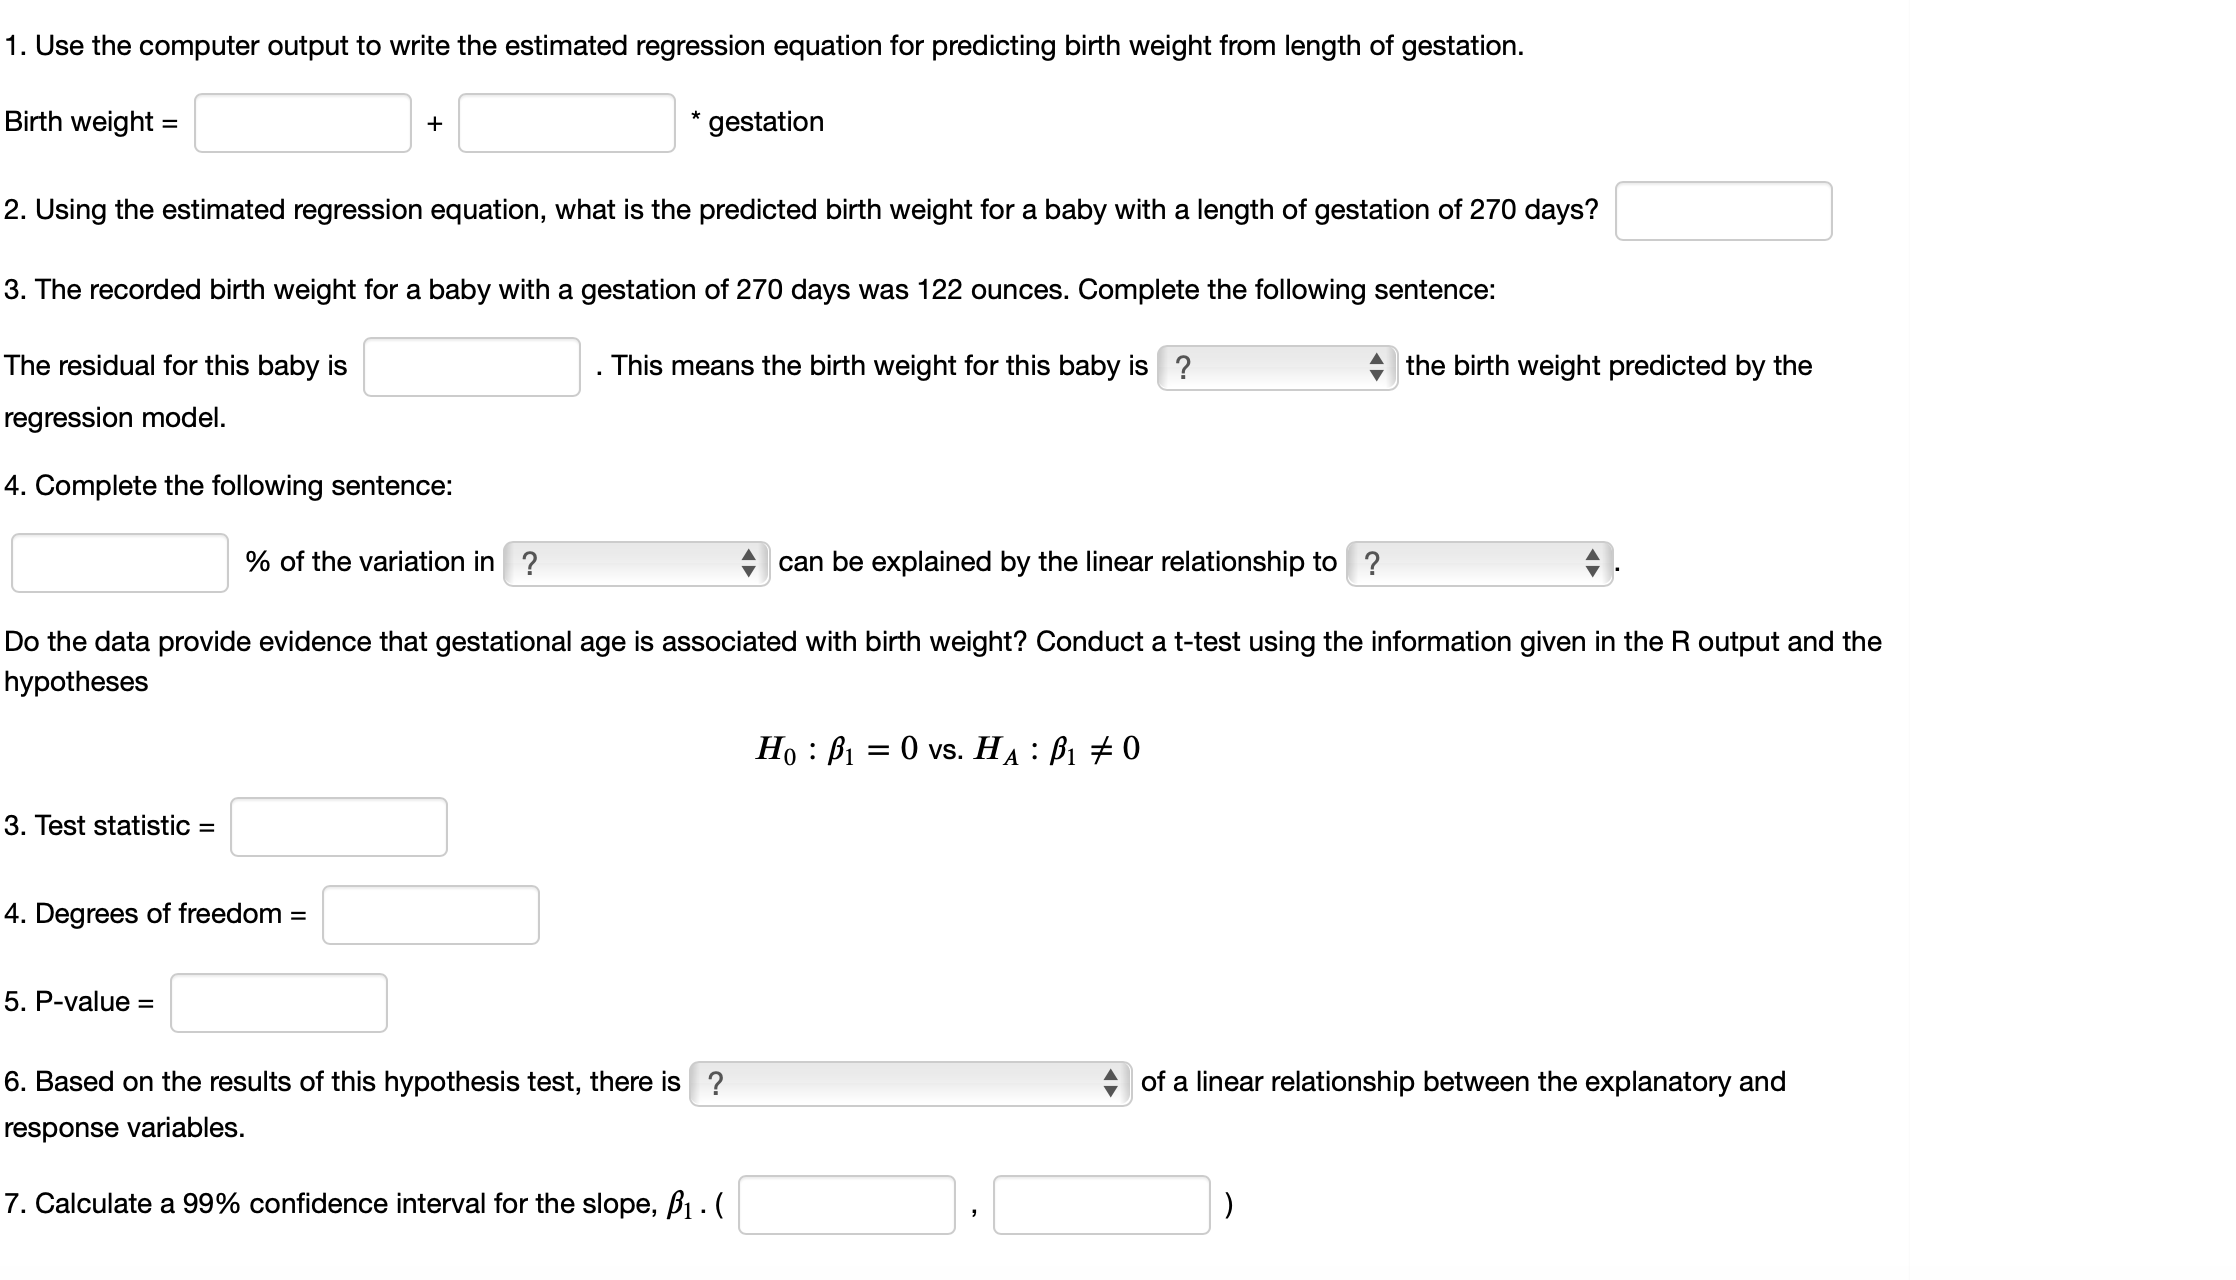
Can you please explain how to solve this practice problem? (14 points) Birth weight and gestational age. The Child Health and Development Studies considered pregnancies

Can you please explain how to solve this practice problem?
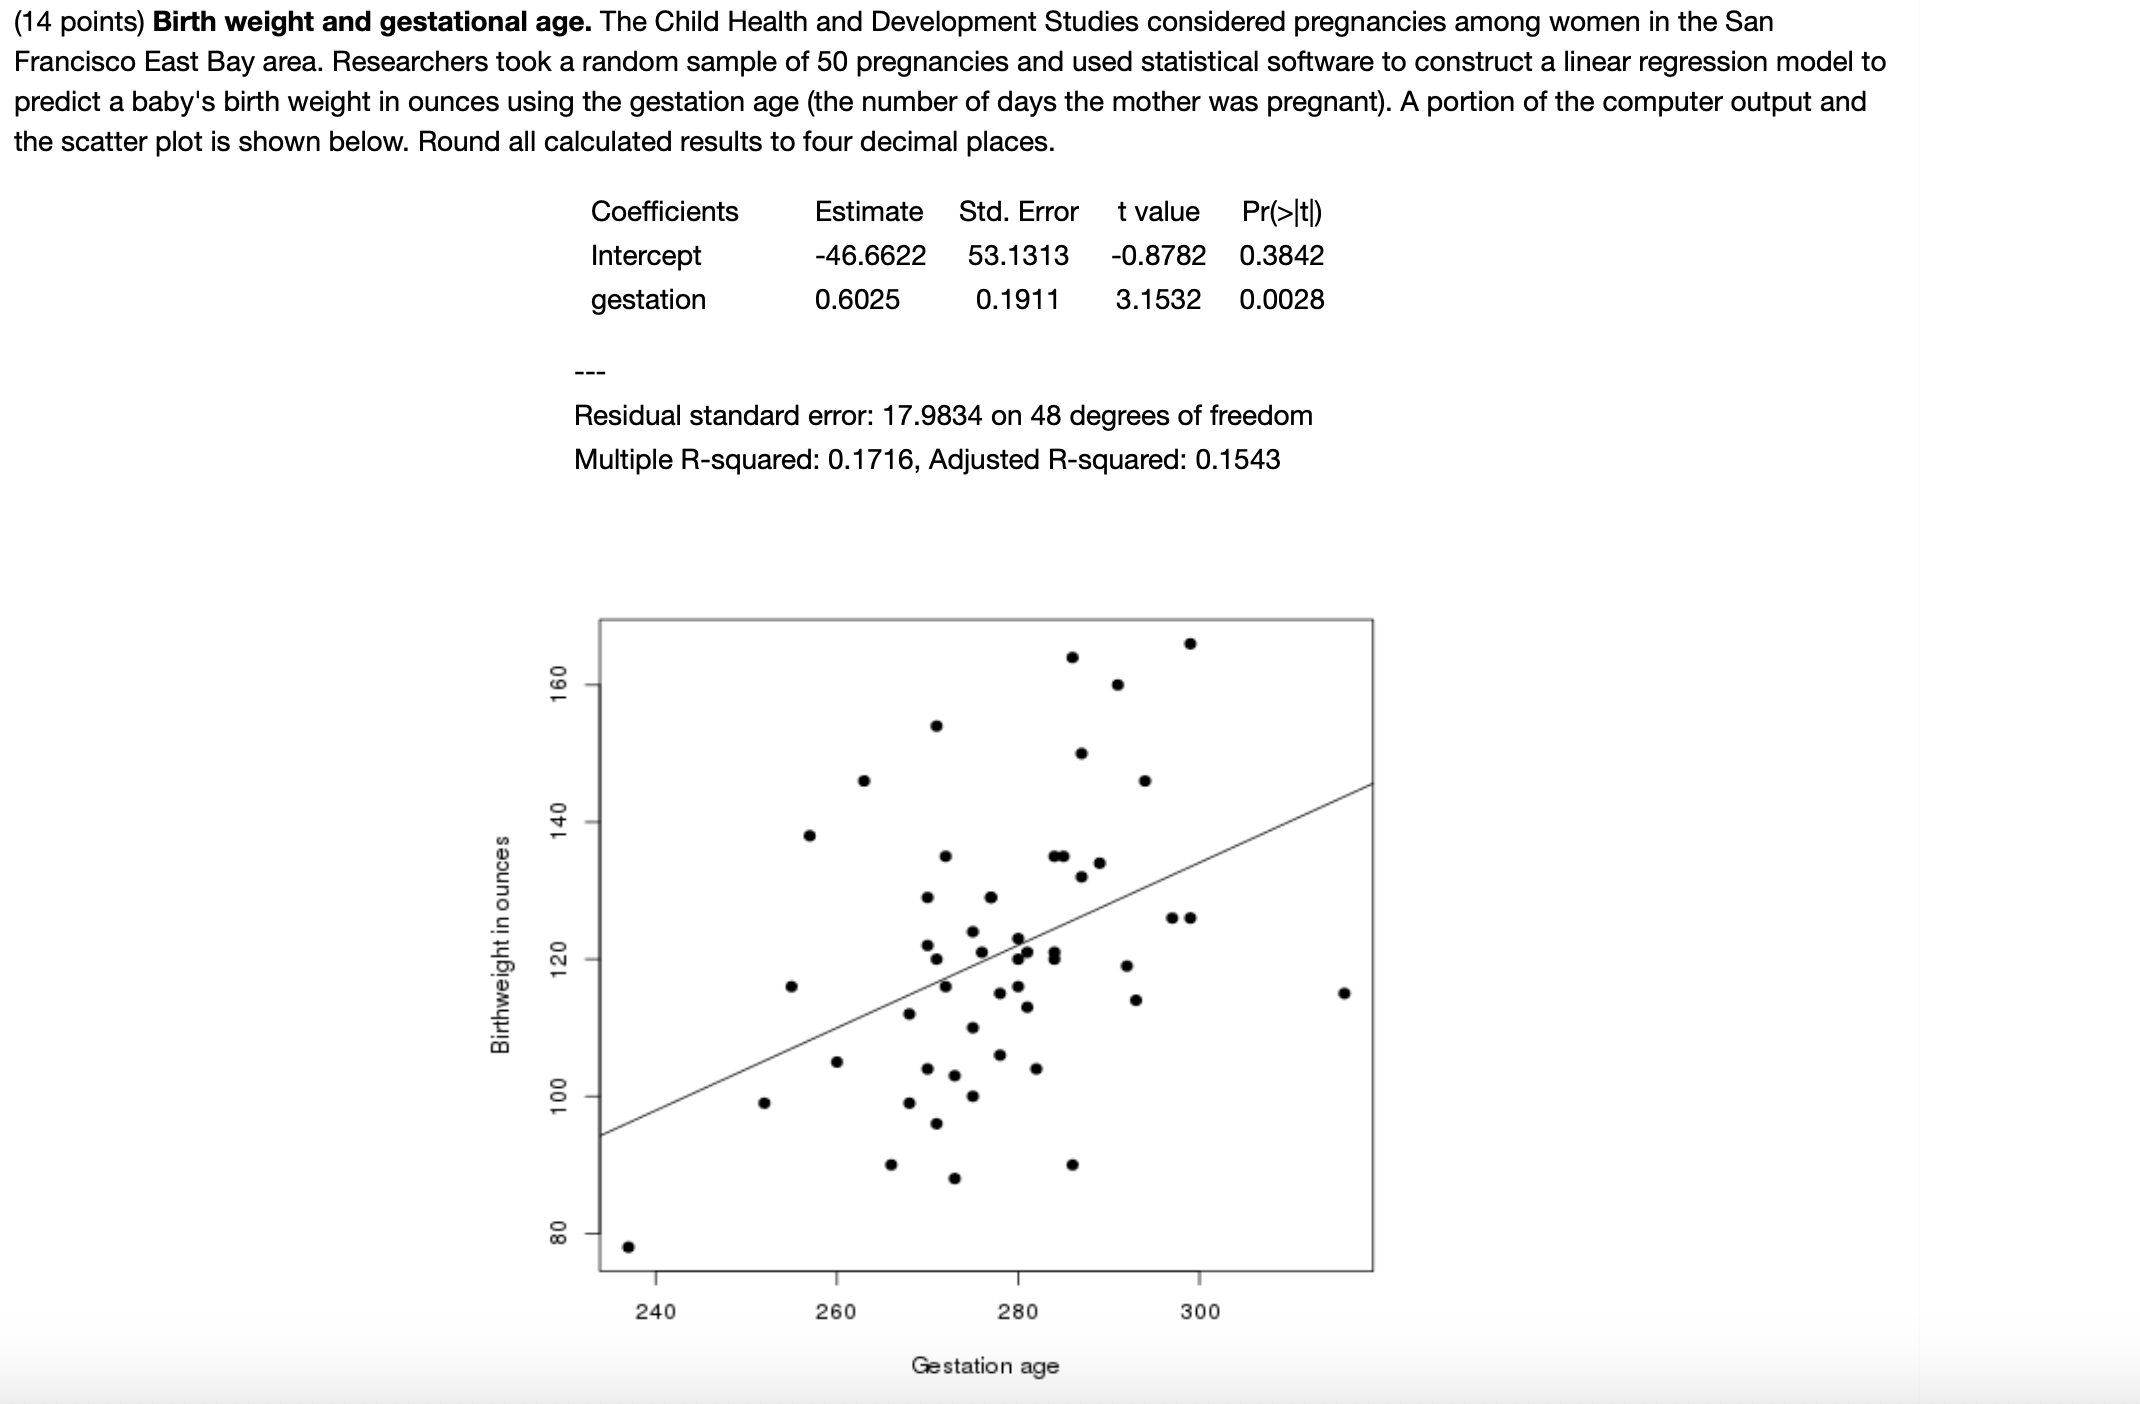
image text in transcribedimage text in transcribed
(14 points) Birth weight and gestational age. The Child Health and Development Studies considered pregnancies among women in the San Francisco East Bay area. Researchers took a random sample of 50 pregnancies and used statistical software to construct a linear regression model to predict a baby's birth weight in ounces using the gestation age (the number of days the mother was pregnant). A portion of the computer output and the scatter plot is shown below. Round all calculated results to four decimal places. Coefficients Estimate Std. Error t value Pr(>|t|) Intercept -46.6622 53.1313 -0.8782 0.3842 gestation 0.6025 0.1911 3.1532 0.0028 Residual standard error: 17.9834 on 48 degrees of freedom Multiple R-squared: 0.1716, Adjusted R-squared: 0.1543 Birthweight in ounce: 100 120 140 160 30 240 260 280 300 G: static n age 1. Use the computer output to write the estimated regression equation for predicting birth weight from length of gestation. Birth weight = + * gestation 2. Using the estimated regression equation, what is the predicted birth weight for a baby with a length of gestation of 270 days? 3. The recorded birth weight for a baby with a gestation of 270 days was 122 ounces. Complete the following sentence: The residual for this baby is . This means the birth weight for this baby is ? c the birth weight predicted by the regression model. 4. Complete the following sentence: % of the variation in ? c can be explained by the linear relationship to ? c . Do the data provide evidence that gestational age is associated with birth weight? Conduct a t-test using the information given in the R output and the hypotheses H021=0VS.HAZ10 3. Test statistic = 4. Degrees of freedom = 5. P-value = 6. Based on the results of this hypothesis test, there is ? c of a linear relationship between the explanatory and response variables. 7. Calculate a 99% confidence interval for the slope, l . ( . )

Step by Step Solution

There are 3 Steps involved in it

Step: 1

blur-text-image

Get Instant Access to Expert-Tailored Solutions

See step-by-step solutions with expert insights and AI powered tools for academic success

Step: 2

blur-text-image

Step: 3

blur-text-image

Ace Your Homework with AI

Get the answers you need in no time with our AI-driven, step-by-step assistance

Get Started

Recommended Textbook for

Fundamentals Of Applied Probability And Random Processes

Authors: Oliver Ibe

1st Edition

0128010355, 9780128010358

More Books

Students also viewed these Mathematics questions

Question

5. What do you understand by the phrase analytical ability?

Answered: 1 week ago