can you please explain this
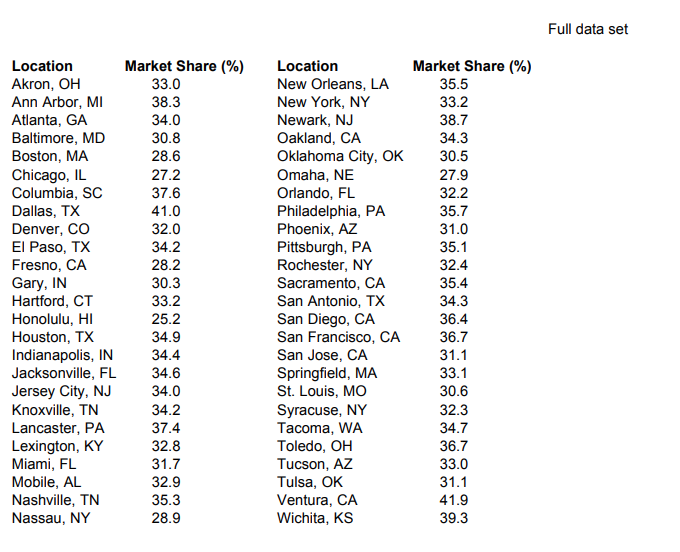
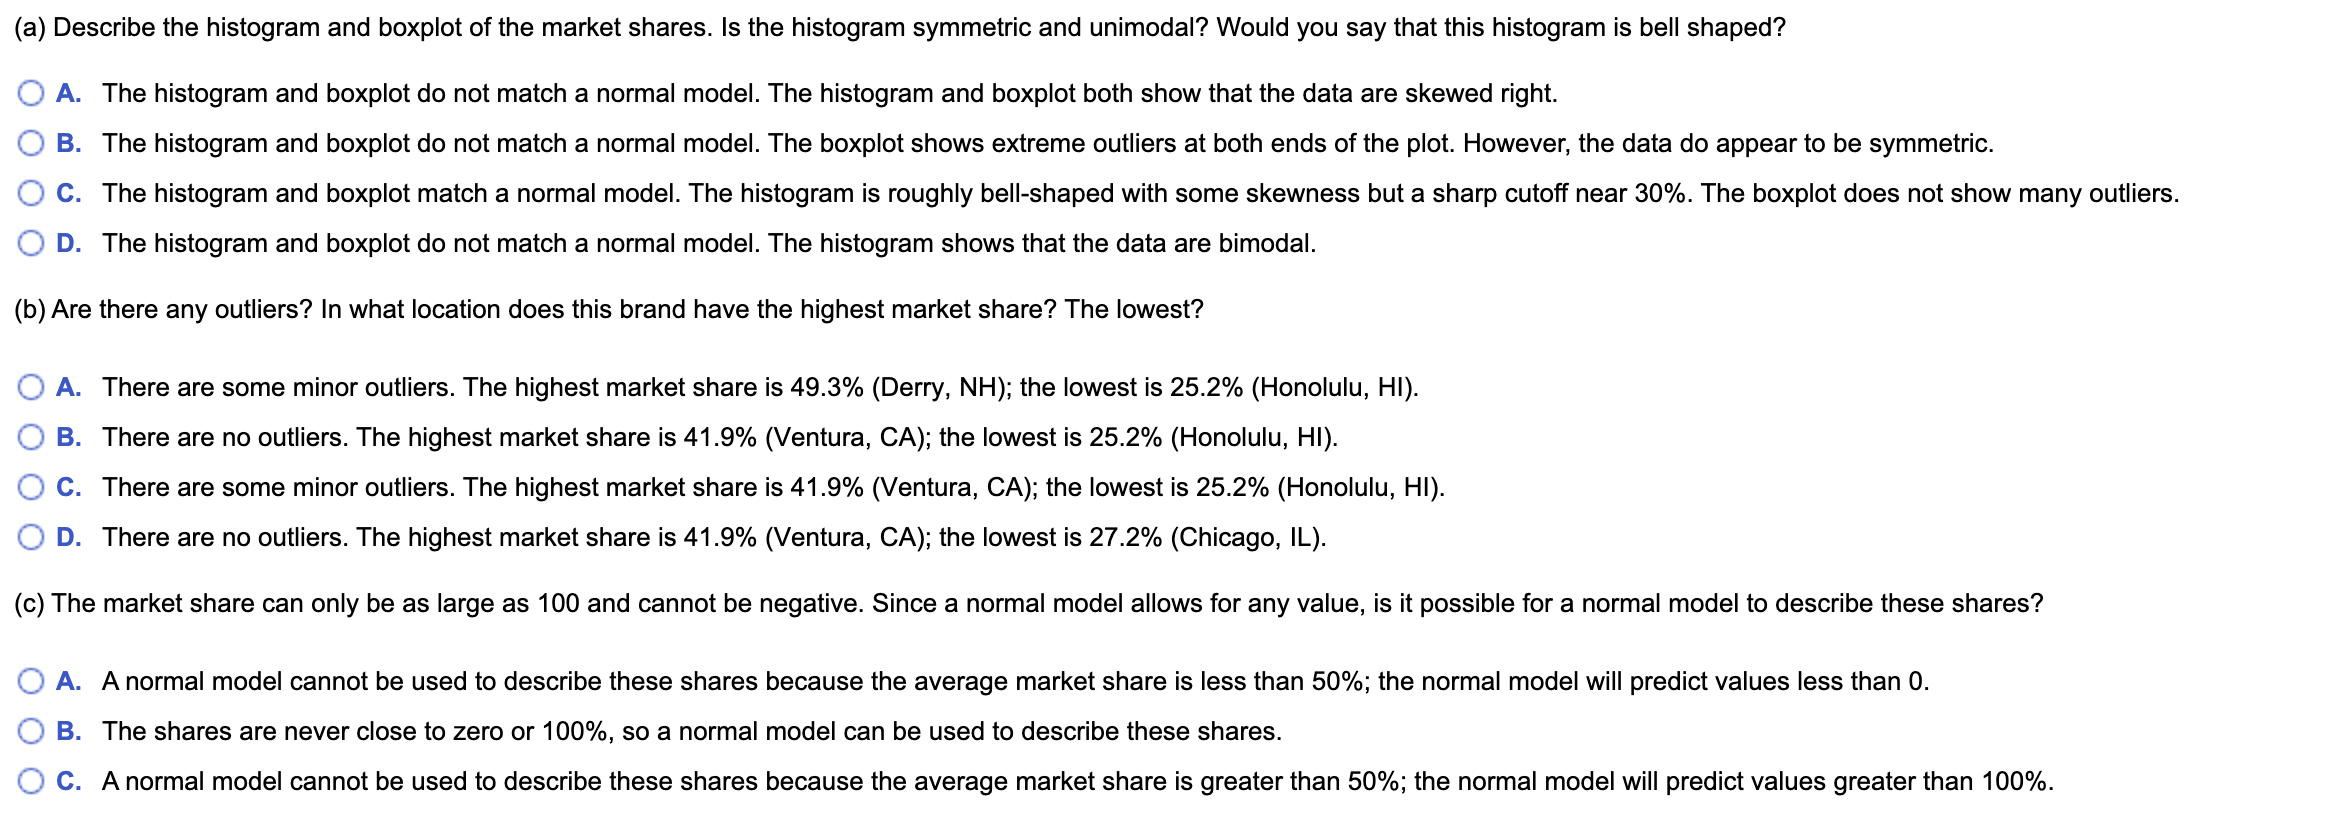
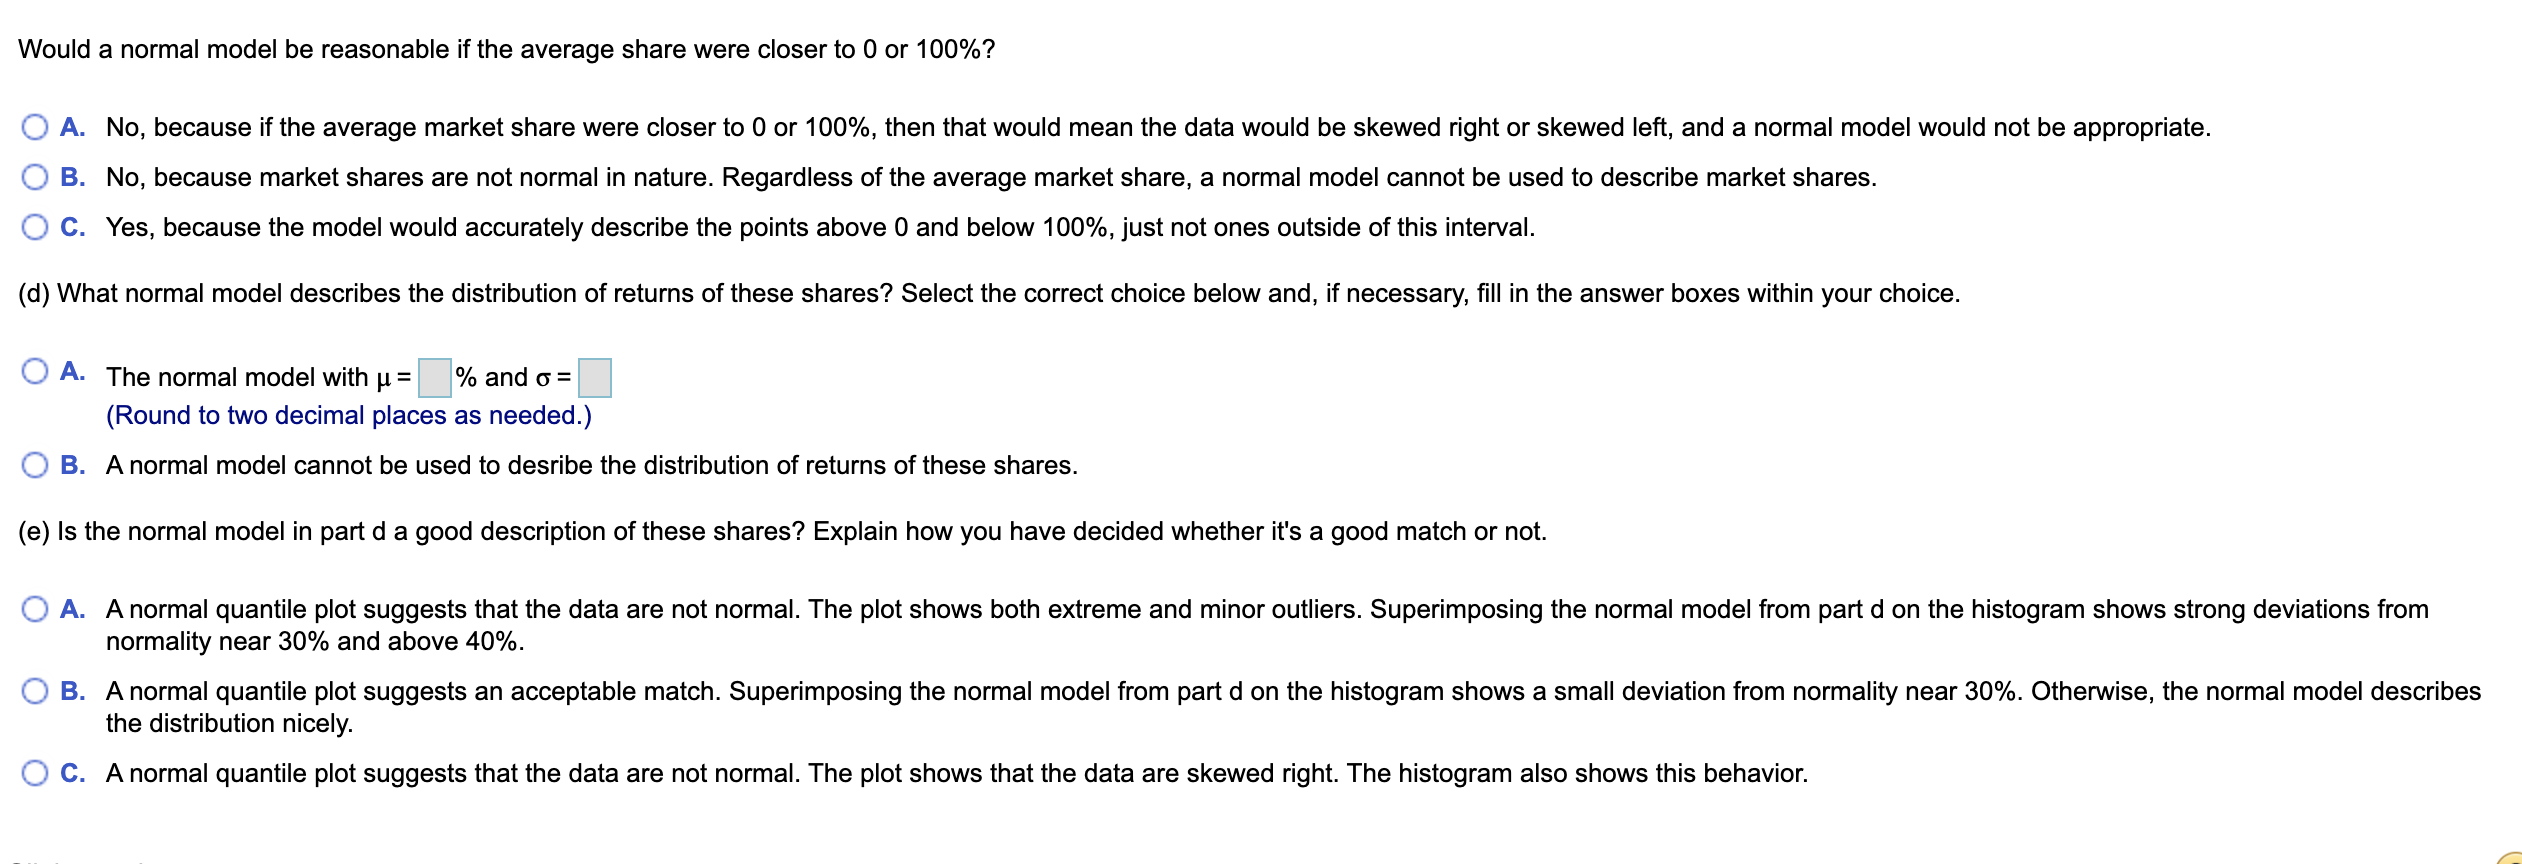
Full data set Location Market Share (%) Location Akron, OH Market Share (%) 33.0 New Orleans, LA 35.5 Ann Arbor, MI 38.3 New York, NY 33.2 Atlanta, GA 34.0 Newark, NJ 38.7 Baltimore, MD 30.8 Oakland, CA 34.3 Boston, MA 28.6 Oklahoma City, OK 30.5 Chicago, IL 27.2 Omaha, NE 27.9 Columbia, SC 37.6 Orlando, FL 32.2 Dallas, TX 41.0 Philadelphia, PA 35.7 Denver, CO 32.0 Phoenix, AZ 31.0 El Paso, TX 34.2 Pittsburgh, PA Fresno, CA 35.1 28.2 Rochester, NY 32.4 Gary, IN 30.3 Hartford, CT Sacramento, CA 35.4 33.2 San Antonio, TX 34.3 Honolulu, HI 25.2 San Diego, CA 36.4 Houston, TX 34.9 San Francisco, CA 36.7 Indianapolis, IN 34.4 San Jose, CA 31.1 Jacksonville, FL 34.6 Springfield, MA 33.1 Jersey City, NJ 34.0 St. Louis, MO 30.6 Knoxville, TN 34.2 Syracuse, NY Lancaster, PA 32.3 37.4 Tacoma, WA 34.7 Lexington, KY 32.8 Toledo, OH 36.7 Miami, FL 31.7 Tucson, AZ 33.0 Mobile, AL 32.9 Tulsa, OK 31.1 Nashville, TN 35.3 Ventura, CA 41.9 Nassau, NY 28.9 Wichita, KS 39.3The accompanying data give the market share (0 to 100%) of a brand-name pharmaceutical product in 50 metropolitan locations. The market share indicates the percentage of all prescriptions for this type of medication that are written for this brand. Complete parts a through e below. =:: Click the icon to view the table of data. (a) Describe the histogram and boxplot of the market shares. Is the histogram symmetric and unimodal? Would you say that this histogram is bell shaped? O A. The histogram and boxplot do not match a normal model. The histogram and boxplot both show that the data are skewed right. 0 B. The histogram and boxplot do not match a normal model. The boxplot shows extreme outliers at both ends of the plot. However, the data do appear to be symmetric. O C. The histogram and boxplot match a normal model. The histogram is roughly bell-shaped with some skewness but a sharp cutoff near 30%. The boxplot does not show many outliers. O D. The histogram and boxplot do not match a normal model. The histogram shows that the data are bimodal. (b) Are there any outliers? In what location does this brand have the highest market share? The lowest? 0 A. There are some minor outliers. The highest market share is 49.3% (Derry, NH); the lowest is 25.2% (Honolulu, HI). 0 B. There are no outliers. The highest market share is 41.9% (Ventura, CA); the lowest is 25.2% (Honolulu, HI). 0 C. There are some minor outliers. The highest market share is 41.9% (Ventura, CA); the lowest is 25.2% (Honolulu, HI). 0 D. There are no outliers. The highest market share is 41.9% (Ventura, CA); the lowest is 27.2% (Chicago, IL). (c) The market share can only be as large as 100 and cannot be negative. Since a normal model allows for any value, is it possible for a normal model to describe these shares? 0 A. A normal model cannot be used to describe these shares because the average market share is less than 50%; the normal model will predict values less than 0. O B. The shares are never close to zero or 100%, so a normal model can be used to describe these shares. 0 C. A normal model cannot be used to describe these shares because the average market share is greater than 50%; the normal model will predict values greater than 100%. Would a normal model be reasonable if the average share were closer to 0 or 100%? O A. No. because if the average market share were closer to 0 or 100%, then that would mean the data would be skewed right or skewed left, and a normal model would not be appropriate. 0 B. No, because market shares are not normal in nature. Regardless of the average market share, a normal model cannot be used to describe market shares. 0 0. Yes, because the model would accurately describe the points above 0 and below 100%, just not ones outside of this interval. (d) What normal model describes the distribution of retums of these shares? Select the correct choice below and, if necessary, ll in the answer boxes within your choice. O A- The normal model with p. = % and o = (Round to two decimal places as needed.) O B. A normal model cannot be used to desribe the distribution of retums of these shares. (e) Is the normal model in part d a good description of these shares? Explain how you have decided whether it's a good match or not. Q A. A normal quantile plot suggests that the data are not normal. The plot shows both extreme and minor outliers. Superimposing the normal model from part d on the histogram shows strong deviations from normality near 30% and above 40%. O B. A normal quantile plot suggests an acceptable match. Superimposing the normal model from part d on the histogram shows a small deviation from normality near 30%. Otherwise, the normal model describes the distribution nicely. O c. A normal quantile plot suggests that the data are not normal. The plot shows that the data are skewed right. The histogram also shows this behavior