Question
Can you please help me on this program? Below are the instructions: Program Description You need to write a program that reads *.txt data from
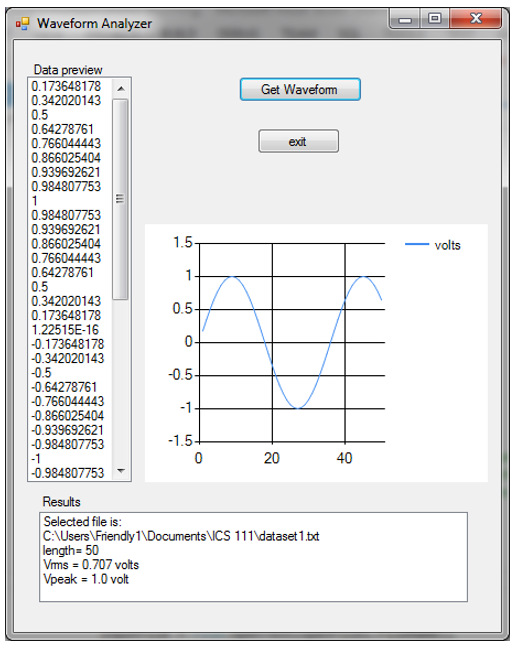
Can you please help me on this program? Below are the instructions: Program Description You need to write a program that reads *.txt data from a file. The program needs to accomplish these tasks. The GUI design is shown at the end of this document.
Make your GUI exactly like this specified design. Read in a file the user chooses (user chooses location). Display the contents (not all needs to be visible in the listBox) Graph the data (Ill give you a handout) Display the path name to the file Display the length of the file (number of lines) Calculate the waveforms root mean square value (rms) Determine the peak value (maximum value) of the waveform
There are four different waveform files (wave1.txt, wave2.txt, wave3.txt, wave4.txt) that are voltage measurements from an oscilloscope. Use these files to test your program.
You will have nine questions to answer when you upload the program. The questions will be: 1. What is the size, in number of lines, of wave1.txt? 2. What is wave1s rms voltage? 3. What is wave1s peak voltage? 4. What is wave2s rms voltage? 5. What is wave2s peak voltage? 6. What is wave3s rms voltage? 7. What is wave3s peak voltage? 8. What is wave4s rms voltage? 9. What is wave4s peak voltage?

This is what I have so far. I was able to display the sine wave based on the listbox data. I'll need to do some calculations to find RMS and Peak voltage. I started to work on some constants but need some help, please.
using System; using System.Collections.Generic; using System.ComponentModel; using System.Data; using System.Drawing; using System.Linq; using System.Text; using System.Threading.Tasks; using System.Windows.Forms; using System.IO; using System.Windows.Forms.DataVisualization.Charting;
namespace Waveform_kenPosney { public partial class Form1 : Form { // Formulas used to calculate rms voltage const double rms = listbox1.RootMeanSquare();
// Formulas used to calculate peak voltage const double peak = 9.8;
// Formulas used to calculate rms voltage const double g = 9.8;
public Form1() { InitializeComponent(); }
// ButtonGetWaveform_Click function to get the waveform data private void buttonGetWaveform_Click(object sender, EventArgs e) { const int SIZE = 400; double[] wave1 = new double[SIZE]; double rms = listBox1.RootMeanSquare();
//make some mathy-looking data for (int i = 0; i
{ wave1[i] = Math.Sin((double)i / SIZE * 8 * Math.PI) / (i + 1E-7); }
foreach (double point in wave1) { this.chart1.Series["Waveform"].Points.AddY(point); }
} } }
Waveform Analyzer Get Wavefom exxt 0.866025404 volts 0.5 0.5 -1 1.5 0.866025404 0 40 CUsers Friendly 1NDocuments ICS 111 dataset 1 bt Vms 0.707 volts vpeak = 1.0 volt
Step by Step Solution
There are 3 Steps involved in it
Step: 1

Get Instant Access to Expert-Tailored Solutions
See step-by-step solutions with expert insights and AI powered tools for academic success
Step: 2

Step: 3

Ace Your Homework with AI
Get the answers you need in no time with our AI-driven, step-by-step assistance
Get Started


