Answered step by step
Verified Expert Solution
Link Copied!

Question

1 Approved Answer

Can you please help me with filling out the chart 3. The table below shows the probabilities of rolling sums from 2 to 12 with

Can you please help me with filling out the chart
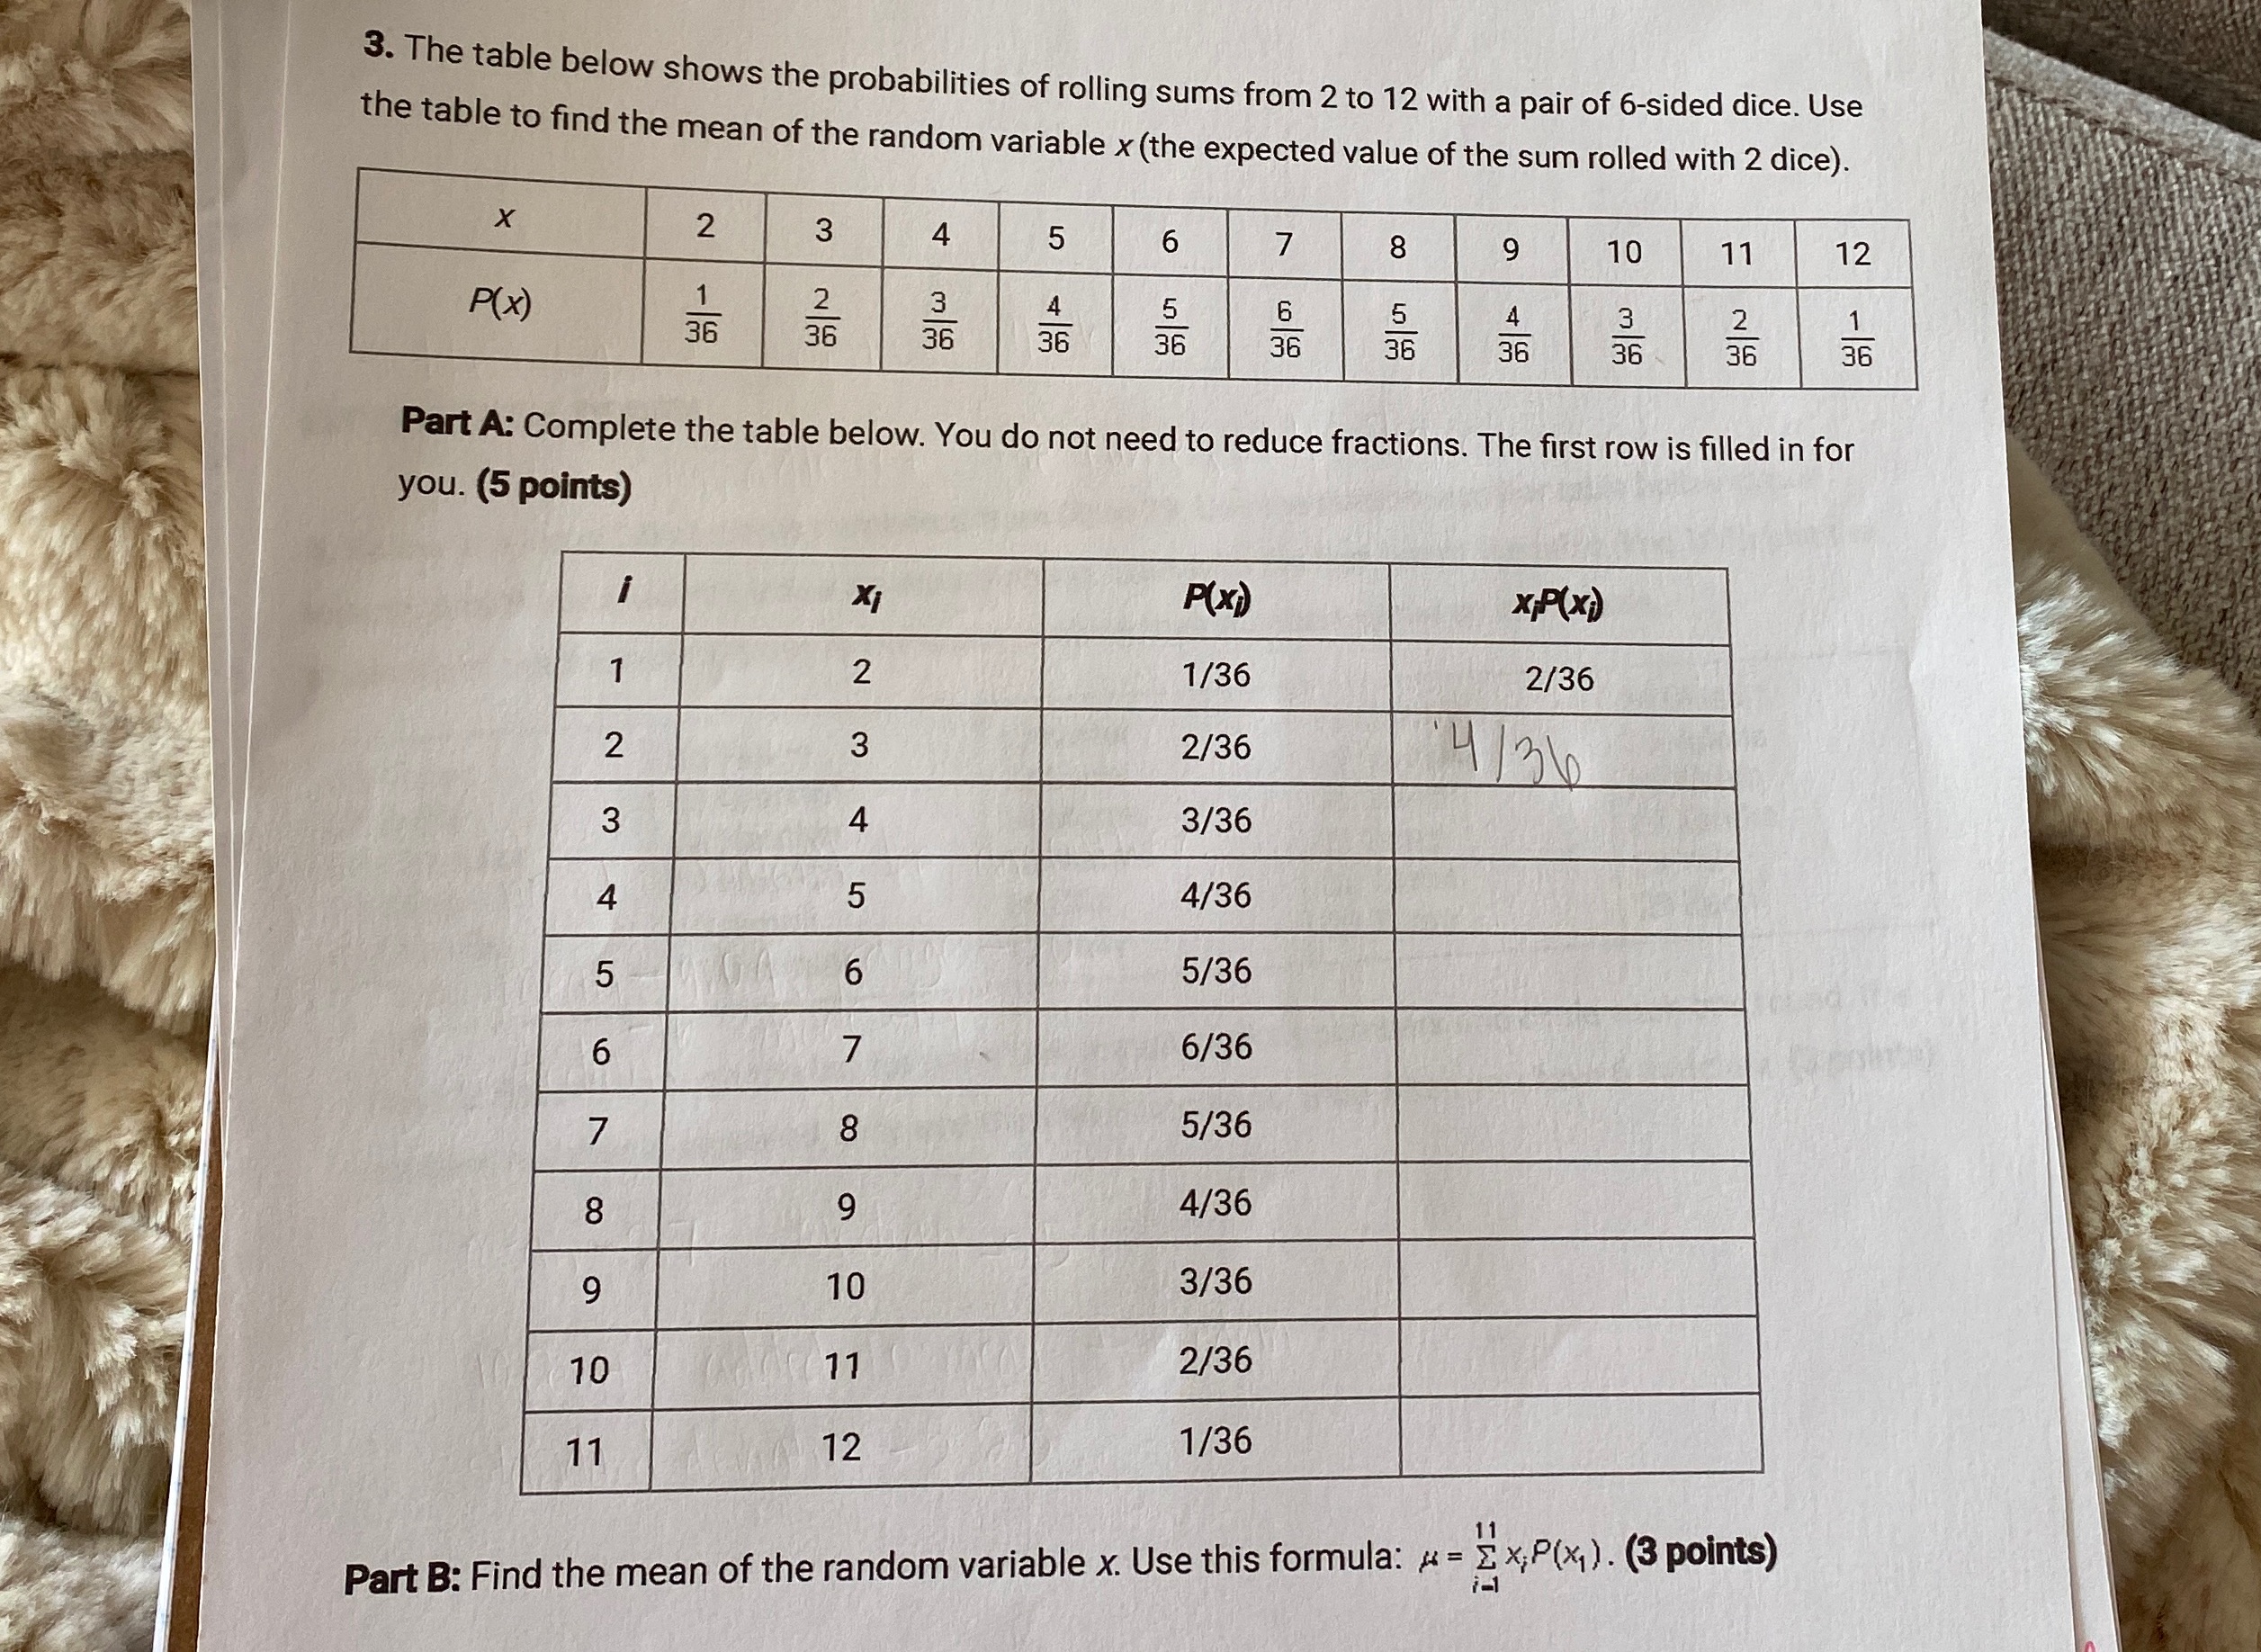
image text in transcribed
3. The table below shows the probabilities of rolling sums from 2 to 12 with a pair of 6-sided dice. Use the table to find the mean of the random variable x (the expected value of the sum rolled with 2 dice). X 2 3 4 5 6 8 9 10 11 12 P(x ) 36 2 5 36 36 36 6 36 36 36 36 3 36 2 36 1 36 Part A: Complete the table below. You do not need to reduce fractions. The first row is filled in for you. (5 points) Xi P ( x) XP(x) 1 N 1/36 2/36 2 3 2/36 4 136 3 4 3/36 4 4/36 5 5/36 6 6/36 7 5/36 8 4/36 9 10 3/36 10 10 71 2/36 11 12 1/36 Part B: Find the mean of the random variable x. Use this formula: 4 = E x;P(x, ). (3 points)

Step by Step Solution

There are 3 Steps involved in it

Step: 1

blur-text-image

Get Instant Access to Expert-Tailored Solutions

See step-by-step solutions with expert insights and AI powered tools for academic success

Step: 2

blur-text-image_2

Step: 3

blur-text-image_3

Ace Your Homework with AI

Get the answers you need in no time with our AI-driven, step-by-step assistance

Get Started

Recommended Textbook for

Shape Optimization And Optimal Design

Authors: John Cagnol

1st Edition

0824705564, 978-0824705565

More Books

Students also viewed these Mathematics questions