Answered step by step
Verified Expert Solution
Link Copied!

Question

1 Approved Answer

can you please help me with this? it will help me a lot.Thanks in advance Lesson 6 (Interpreting Interval Estimate of a Po... Exercises 1.

can you please help me with this? it will help me a lot.Thanks in advance
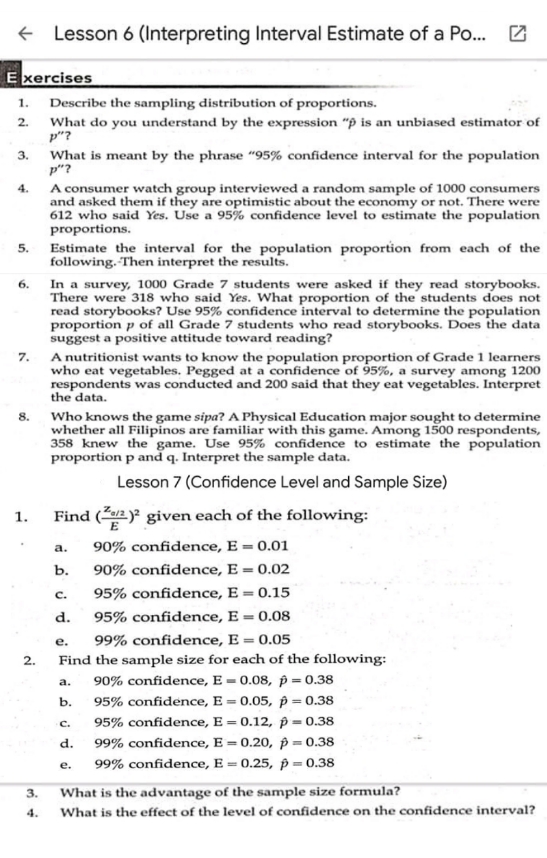
image text in transcribed
Lesson 6 (Interpreting Interval Estimate of a Po... Exercises 1. Describe the sampling distribution of proportions. 2. What do you understand by the expression "p is an unbiased estimator of p"? 3. What is meant by the phrase "95% confidence interval for the population p"? A consumer watch group interviewed a random sample of 1000 consumers and asked them if they are optimistic about the economy or not. There were 612 who said Yes. Use a 95% confidence level to estimate the population proportions. 5. Estimate the interval for the population proportion from each of the following. Then interpret the results. 6. In a survey, 1000 Grade 7 students were asked if they read storybooks. There were 318 who said Yes. What proportion of the students does not read storybooks? Use 95% confidence interval to determine the population proportion p of all Grade 7 students who read storybooks. Does the data suggest a positive attitude toward reading? 7. A nutritionist wants to know the population proportion of Grade 1 learners who eat vegetables. Pegged at a confidence of 95%, a survey among 1200 respondents was conducted and 200 said that they eat vegetables. Interpret the data. 8. Who knows the game sipa? A Physical Education major sought to determine whether all Filipinos are familiar with this game. Among 1500 respondents, 358 knew the game. Use 95% confidence to estimate the population proportion p and q. Interpret the sample data. Lesson 7 (Confidence Level and Sample Size) 1. Find (-/2)3 given each of the following: a. 90% confidence, E = 0.01 b. 90% confidence, E = 0.02 C. 95% confidence, E = 0.15 d. 95% confidence, E = 0.08 e. 99% confidence, E = 0.05 2. Find the sample size for each of the following: a. 90% confidence, E - 0.08, p = 0.38 b. 95% confidence, E = 0.05, p =0.38 C. 95% confidence, E = 0.12, p = 0.38 d. 99% confidence, E = 0.20, p = 0.38 e. 99% confidence, E = 0.25, p = 0.38 3. What is the advantage of the sample size formula? 4. What is the effect of the level of confidence on the confidence interval

Step by Step Solution

There are 3 Steps involved in it

Step: 1

blur-text-image

Get Instant Access to Expert-Tailored Solutions

See step-by-step solutions with expert insights and AI powered tools for academic success

Step: 2

blur-text-image

Step: 3

blur-text-image

Ace Your Homework with AI

Get the answers you need in no time with our AI-driven, step-by-step assistance

Get Started

Recommended Textbook for

An Introduction to the Mathematics of financial Derivatives

Authors: Salih N. Neftci

2nd Edition

978-0125153928, 9780080478647, 125153929, 978-0123846822

More Books

Students also viewed these Mathematics questions