

Answered step by step
Verified Expert Solution
Question
1 Approved Answer
Can you please interperet/explain this graph to me? Part Three Estimating the Cost of Capital adjusted hurdle rates. FIGURE 14.1. Meyer's diagram of constant versus
Can you please interperet/explain this graph to me? 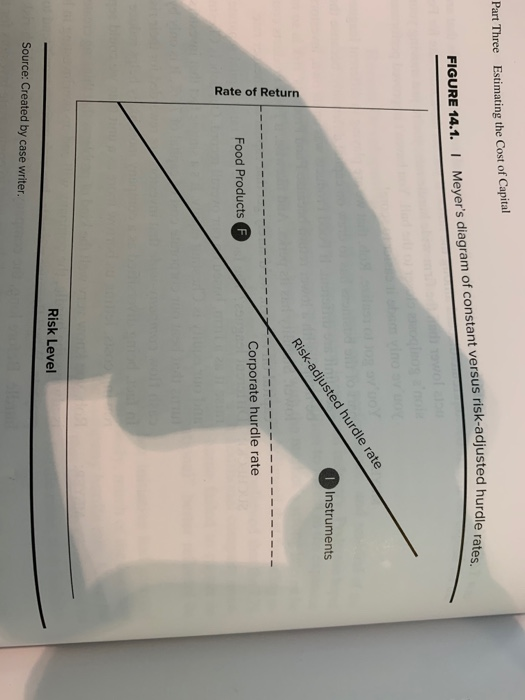
Part Three Estimating the Cost of Capital adjusted hurdle rates. FIGURE 14.1. Meyer's diagram of constant versus risk-adjusted hurdle Instruments Risk-adjusted hurdle rate Rate of Return Corporate hurdle rate Food Products Risk Level Source: Created by case writer Step by Step Solution
There are 3 Steps involved in it
Step: 1

Get Instant Access to Expert-Tailored Solutions
See step-by-step solutions with expert insights and AI powered tools for academic success
Step: 2

Step: 3
Ace Your Homework with AI
Get the answers you need in no time with our AI-driven, step-by-step assistance
Get Started
The Palgrave International Handbook Of Basic Income
Authors: Malcolm Torry
1st Edition
3030236137, 978-3030236137