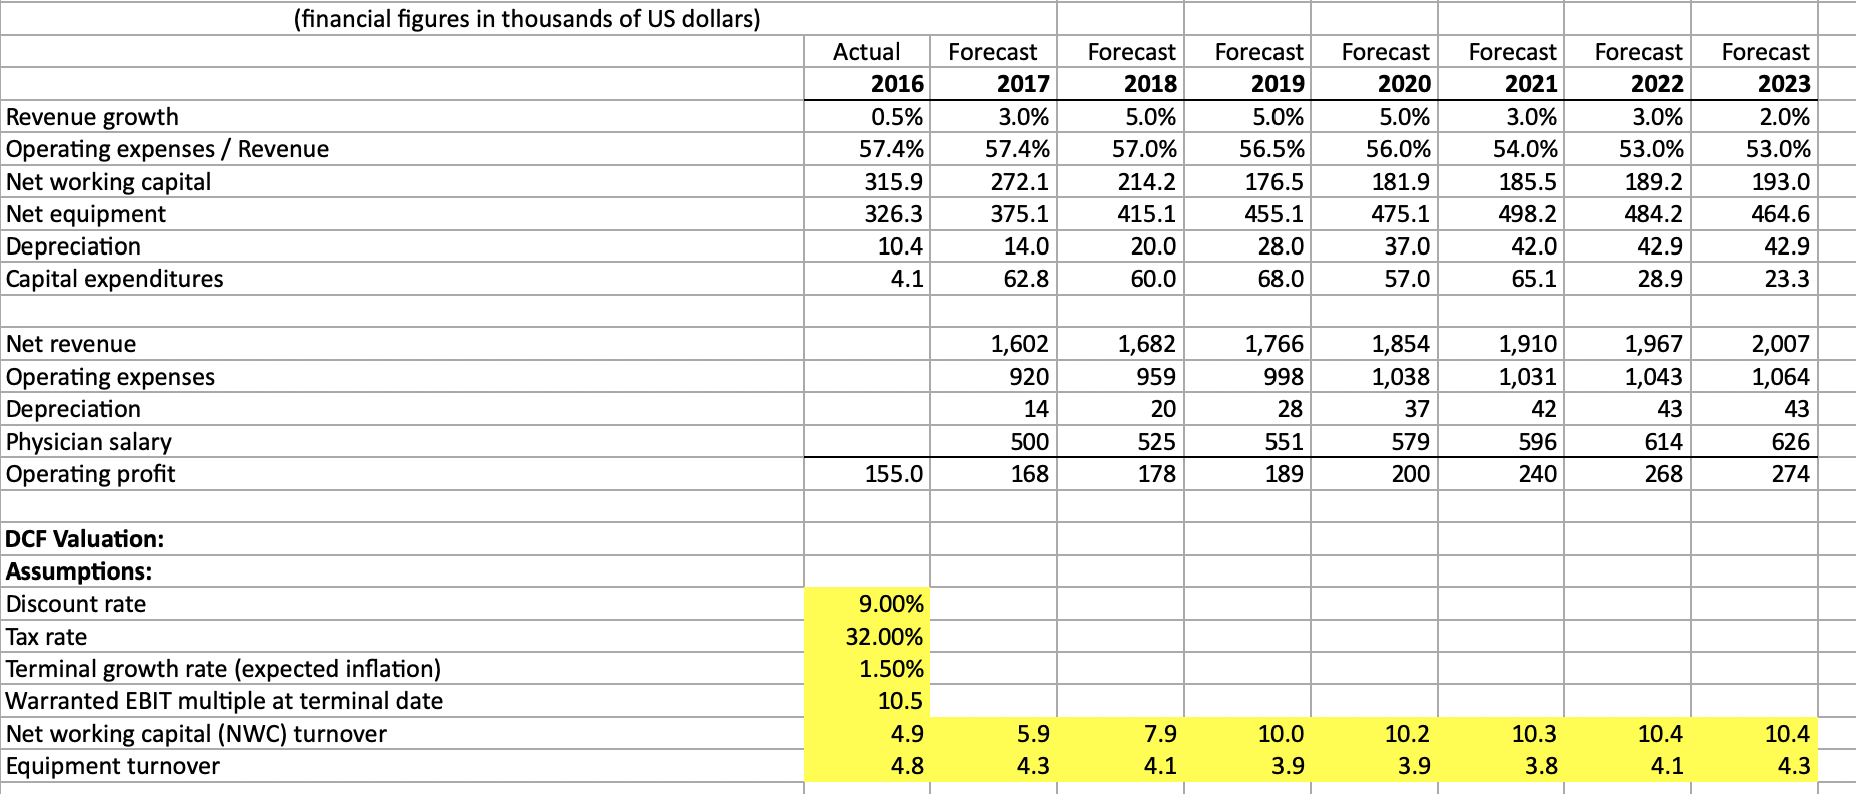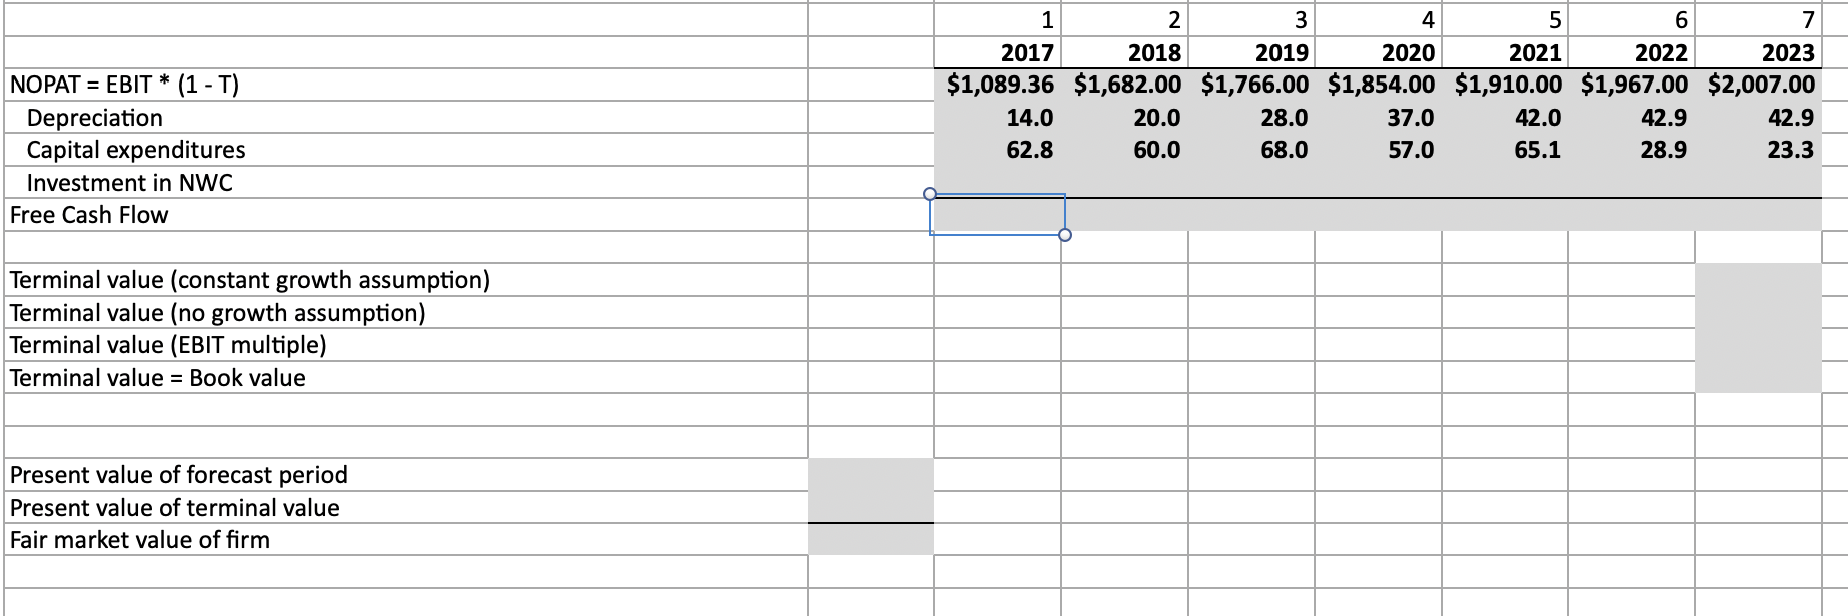
 Can you please please show the excel formulas on how to get the rest of the spreadsheet filled out. Ive been stuck for so long please please help.
(financial figures in thousands of US dollars) Revenue growth Operating expenses / Revenue Net working capital Net equipment Depreciation Capital expenditures Actual 2016 0.5% 57.4% 315.9 326.3 10.4 4.1 Forecast 2017 3.0% 57.4% 272.1 375.1 14.0 62.8 Forecast 2018 5.0% 57.0% 214.2 415.1 20.0 60.0 Forecast 2019 5.0% 56.5% 176.5 455.1 28.0 68.0 Forecast 2020 5.0% 56.0% 181.9 475.1 37.0 57.0 Forecast 2021 3.0% 54.0% 185.5 498.2 42.0 65.1 Forecast 2022 3.0% 53.0% 189.2 484.2 42.9 28.9 Forecast 2023 2.0% 53.0% 193.0 464.6 42.9 23.3 1,602 920 Net revenue Operating expenses Depreciation Physician salary Operating profit 1,910 1,031 1,682 959 20 525 178 1,854 1,038 37 14 1,766 998 28 551 189 42 1,967 1,043 43 614 268 2,007 1,064 43 626 274 596 500 168 579 200 155.0 240 DCF Valuation: Assumptions: Discount rate Tax rate Terminal growth rate (expected inflation) Warranted EBIT multiple at terminal date Net working capital (NWC) turnover Equipment turnover 9.00% 32.00% 1.50% 10.5 4.9 4.8 5.9 4.3 7.9 4.1 10.0 3.9 10.2 3.9 10.3 3.8 10.4 4.1 10.4 4.3 NOPAT = EBIT * (1 - T) Depreciation Capital expenditures Investment in NWC Free Cash Flow 1 2 3 4 5 6 7 2017 2018 2019 2020 2021 2022 2023 $1,089.36 $1,682.00 $1,766.00 $1,854.00 $1,910.00 $1,967.00 $2,007.00 14.0 20.0 28.0 37.0 42.0 42.9 42.9 62.8 60.0 68.0 57.0 65.1 28.9 23.3 Terminal value (constant growth assumption) Terminal value (no growth assumption) Terminal value (EBIT multiple) Terminal value = Book value Present value of forecast period Present value of terminal value Fair market value of firm (financial figures in thousands of US dollars) Revenue growth Operating expenses / Revenue Net working capital Net equipment Depreciation Capital expenditures Actual 2016 0.5% 57.4% 315.9 326.3 10.4 4.1 Forecast 2017 3.0% 57.4% 272.1 375.1 14.0 62.8 Forecast 2018 5.0% 57.0% 214.2 415.1 20.0 60.0 Forecast 2019 5.0% 56.5% 176.5 455.1 28.0 68.0 Forecast 2020 5.0% 56.0% 181.9 475.1 37.0 57.0 Forecast 2021 3.0% 54.0% 185.5 498.2 42.0 65.1 Forecast 2022 3.0% 53.0% 189.2 484.2 42.9 28.9 Forecast 2023 2.0% 53.0% 193.0 464.6 42.9 23.3 1,602 920 Net revenue Operating expenses Depreciation Physician salary Operating profit 1,910 1,031 1,682 959 20 525 178 1,854 1,038 37 14 1,766 998 28 551 189 42 1,967 1,043 43 614 268 2,007 1,064 43 626 274 596 500 168 579 200 155.0 240 DCF Valuation: Assumptions: Discount rate Tax rate Terminal growth rate (expected inflation) Warranted EBIT multiple at terminal date Net working capital (NWC) turnover Equipment turnover 9.00% 32.00% 1.50% 10.5 4.9 4.8 5.9 4.3 7.9 4.1 10.0 3.9 10.2 3.9 10.3 3.8 10.4 4.1 10.4 4.3 NOPAT = EBIT * (1 - T) Depreciation Capital expenditures Investment in NWC Free Cash Flow 1 2 3 4 5 6 7 2017 2018 2019 2020 2021 2022 2023 $1,089.36 $1,682.00 $1,766.00 $1,854.00 $1,910.00 $1,967.00 $2,007.00 14.0 20.0 28.0 37.0 42.0 42.9 42.9 62.8 60.0 68.0 57.0 65.1 28.9 23.3 Terminal value (constant growth assumption) Terminal value (no growth assumption) Terminal value (EBIT multiple) Terminal value = Book value Present value of forecast period Present value of terminal value Fair market value of firm

 Can you please please show the excel formulas on how to get the rest of the spreadsheet filled out. Ive been stuck for so long please please help.


