Answered step by step
Verified Expert Solution
Question
1 Approved Answer
can you please provide me with three example of random cause of variation and three example of nonrandom cause of variation? For your help below
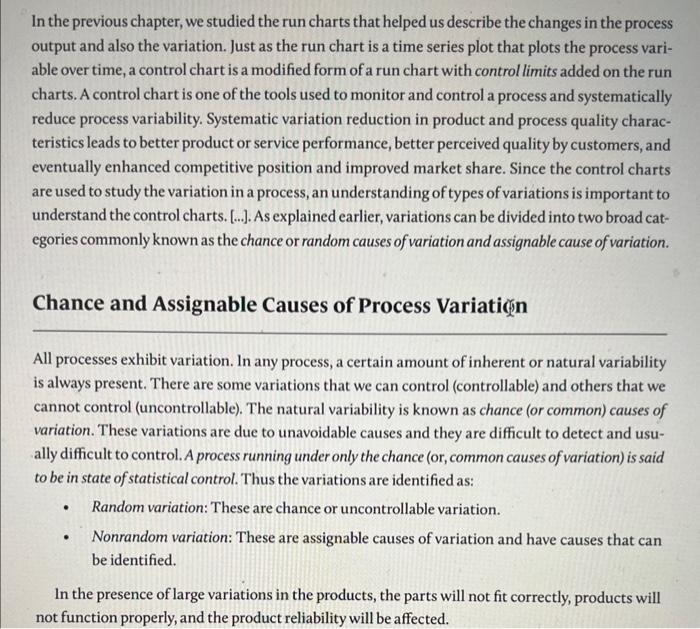
can you please provide me with three example of random cause of variation and three example of nonrandom cause of variation? For your help below i have attached a picture of a book explaining what is random and non random variation. and please answer them properly 
In the previous chapter, we studied the run charts that helped us describe the changes in the process output and also the variation. Just as the run chart is a time series plot that plots the process variable over time, a control chart is a modified form of a run chart with control limits added on the run charts. A control chart is one of the tools used to monitor and control a process and systematically reduce process variability. Systematic variation reduction in product and process quality characteristics leads to better product or service performance, better perceived quality by customers, and eventually enhanced competitive position and improved market share. Since the control charts are used to study the variation in a process, an understanding of types of variations is important to understand the control charts. [...]. As explained earlier, variations can be divided into two broad categories commonly known as the chance or random causes of variation and assignable cause of variation. Chance and Assignable Causes of Process Variatin All processes exhibit variation. In any process, a certain amount of inherent or natural variability is always present. There are some variations that we can control (controllable) and others that we cannot control (uncontrollable). The natural variability is known as chance (or common) causes of variation. These variations are due to unavoidable causes and they are difficult to detect and usually difficult to control. A process running under only the chance (or, common causes of variation) is said to be in state of statistical control. Thus the variations are identified as: - Random variation: These are chance or uncontrollable variation. - Nonrandom variation: These are assignable causes of variation and have causes that can be identified. In the presence of large variations in the products, the parts will not fit correctly, products will not function properly, and the product reliability will be affected 
Step by Step Solution
There are 3 Steps involved in it
Step: 1

Get Instant Access to Expert-Tailored Solutions
See step-by-step solutions with expert insights and AI powered tools for academic success
Step: 2

Step: 3

Ace Your Homework with AI
Get the answers you need in no time with our AI-driven, step-by-step assistance
Get Started


