

Answered step by step
Verified Expert Solution
Question
1 Approved Answer
can you please solve D Chapter 8 - Master it! In practice, the use of the dividend discount model is refined from the method we
can you please solve D
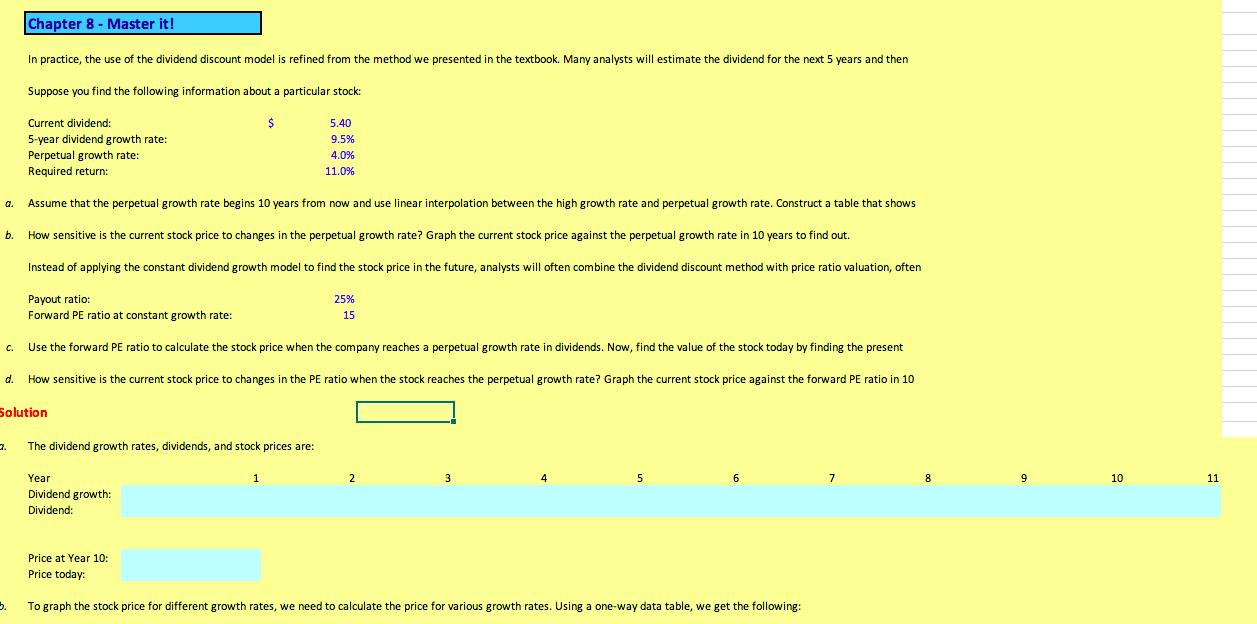
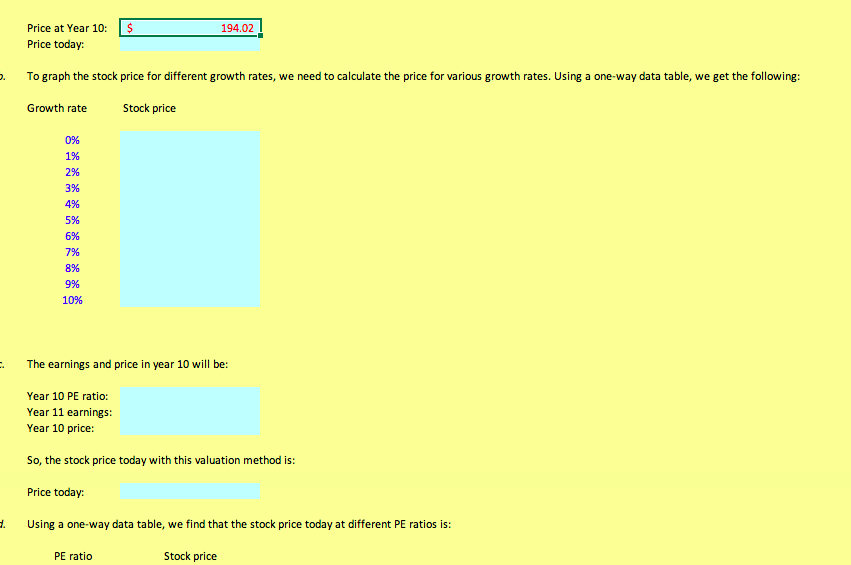
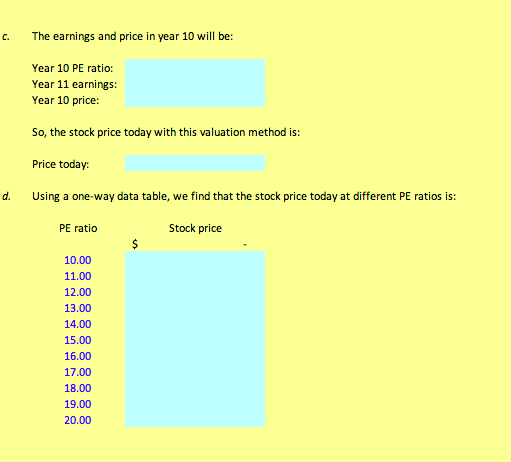
Chapter 8 - Master it! In practice, the use of the dividend discount model is refined from the method we presented in the textbook. Many analysts will estimate the dividend for the next 5 years and then Suppose you find the following information about a particular stock: $ Current dividend: 5-year dividend growth rate: Perpetual growth rate: Required return: 5.40 9.5% 4.0% 11.0% a. Assume that the perpetual growth rate begins 10 years from now and use linear interpolation between the high growth rate and perpetual growth rate. Construct a table that shows b. How sensitive is the current stock price to changes in the perpetual growth rate? Graph the current stock price against the perpetual growth rate in 10 years to find out. Instead of applying the constant dividend growth model to find the stock price in the future, analysts will often combine the dividend discount method with price ratio valuation, often Payout ratio: Forward PE ratio at constant growth rate: 25% 15 C. Use the forward PE ratio to calculate the stock price when the company reaches a perpetual growth rate in dividends. Now, find the value of the stock today by finding the present d. How sensitive is the current stock price to changes in the PE ratio when the stock reaches the perpetual growth rate? Graph the current stock price against the forward PE ratio in 10 Solution .. The dividend growth rates, dividends, and stock prices are: 1 2. 7 10 11 Year Dividend growth: Dividend: Price at Year 10: Price today 5. To graph the stock price for different growth rates, we need to calculate the price for various growth rates. Using a one-way data table, we get the following: $ 194.02 Price at Year 10: Price today: . . To graph the stock price for different growth rates, we need to calculate the price for various growth rates. Using a one-way data table, we get the following: Growth rate Stock price 0% 1% 2% 3% 4% 5% 6% 7% 8% 9% 10% . The earnings and price in year 10 will be: Year 10 PE ratio: Year 11 earnings: Year 10 price: So, the stock price today with this valuation method is: Price today: . Using a one-way data table, we find that the stock price today at different PE ratios is: PE ratio Stock price C. The earnings and price in year 10 will be: Year 10 PE ratio: Year 11 earnings: Year 10 price: So, the stock price today with this valuation method is: Price today: d. Using a one-way data table, we find that the stock price today at different PE ratios is: PE ratio Stock price $ 10.00 11.00 12.00 13.00 14.00 15.00 16.00 17.00 18.00 19.00 20.00 Chapter 8 - Master it! In practice, the use of the dividend discount model is refined from the method we presented in the textbook. Many analysts will estimate the dividend for the next 5 years and then Suppose you find the following information about a particular stock: $ Current dividend: 5-year dividend growth rate: Perpetual growth rate: Required return: 5.40 9.5% 4.0% 11.0% a. Assume that the perpetual growth rate begins 10 years from now and use linear interpolation between the high growth rate and perpetual growth rate. Construct a table that shows b. How sensitive is the current stock price to changes in the perpetual growth rate? Graph the current stock price against the perpetual growth rate in 10 years to find out. Instead of applying the constant dividend growth model to find the stock price in the future, analysts will often combine the dividend discount method with price ratio valuation, often Payout ratio: Forward PE ratio at constant growth rate: 25% 15 C. Use the forward PE ratio to calculate the stock price when the company reaches a perpetual growth rate in dividends. Now, find the value of the stock today by finding the present d. How sensitive is the current stock price to changes in the PE ratio when the stock reaches the perpetual growth rate? Graph the current stock price against the forward PE ratio in 10 Solution .. The dividend growth rates, dividends, and stock prices are: 1 2. 7 10 11 Year Dividend growth: Dividend: Price at Year 10: Price today 5. To graph the stock price for different growth rates, we need to calculate the price for various growth rates. Using a one-way data table, we get the following: $ 194.02 Price at Year 10: Price today: . . To graph the stock price for different growth rates, we need to calculate the price for various growth rates. Using a one-way data table, we get the following: Growth rate Stock price 0% 1% 2% 3% 4% 5% 6% 7% 8% 9% 10% . The earnings and price in year 10 will be: Year 10 PE ratio: Year 11 earnings: Year 10 price: So, the stock price today with this valuation method is: Price today: . Using a one-way data table, we find that the stock price today at different PE ratios is: PE ratio Stock price C. The earnings and price in year 10 will be: Year 10 PE ratio: Year 11 earnings: Year 10 price: So, the stock price today with this valuation method is: Price today: d. Using a one-way data table, we find that the stock price today at different PE ratios is: PE ratio Stock price $ 10.00 11.00 12.00 13.00 14.00 15.00 16.00 17.00 18.00 19.00 20.00Step by Step Solution
There are 3 Steps involved in it
Step: 1

Get Instant Access to Expert-Tailored Solutions
See step-by-step solutions with expert insights and AI powered tools for academic success
Step: 2

Step: 3
Ace Your Homework with AI
Get the answers you need in no time with our AI-driven, step-by-step assistance
Get Started
Ethics In Finance
Authors: John R. Boatright
3rd Edition
1118615824, 978-1118615829