

Answered step by step
Verified Expert Solution
Question
1 Approved Answer
can you please solve that Clifford Clark is a recent retiree who is interested in investing some of his savings in corporate bonds. His financial
can you please solve that 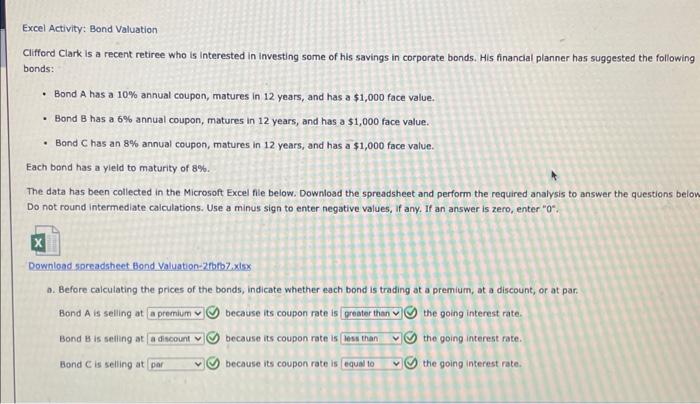
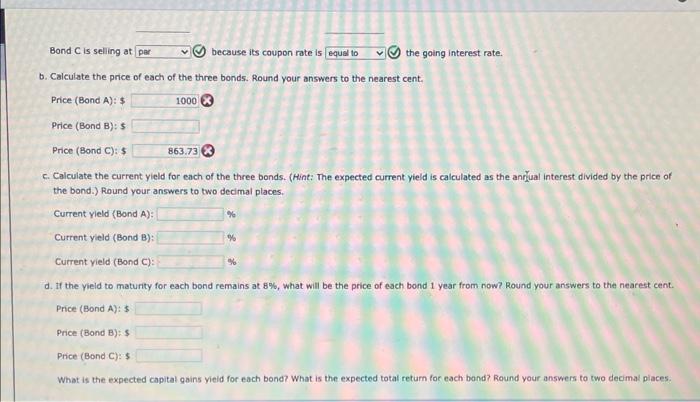
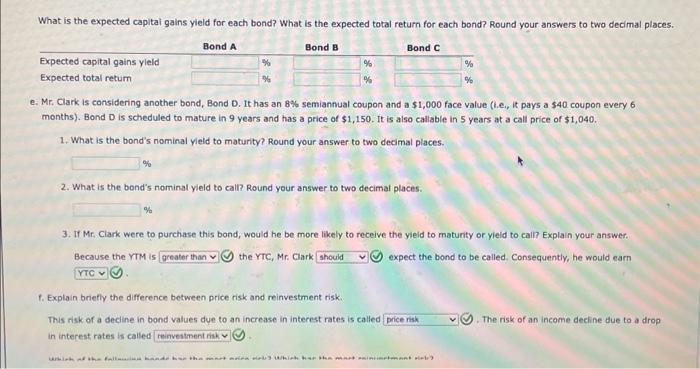
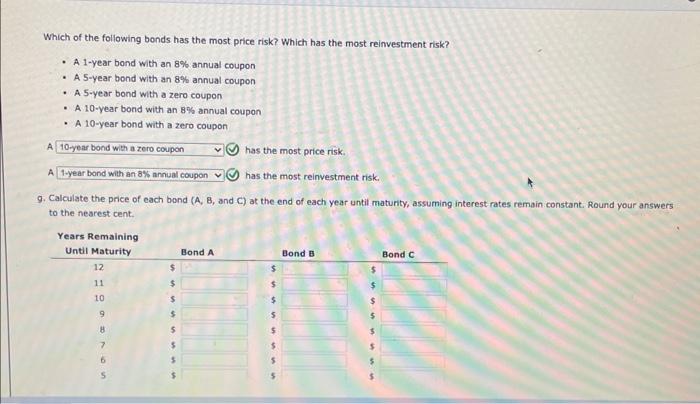
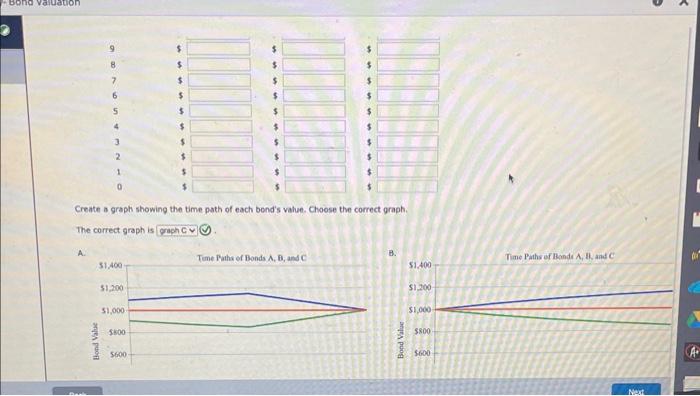
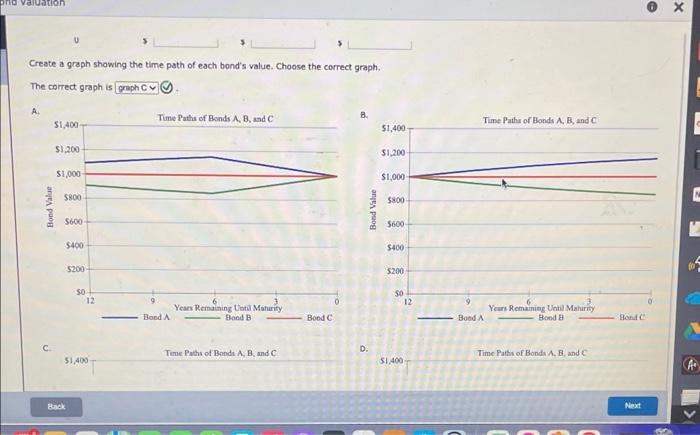
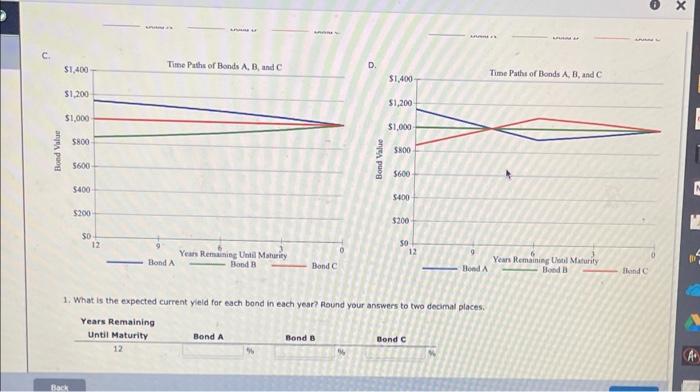
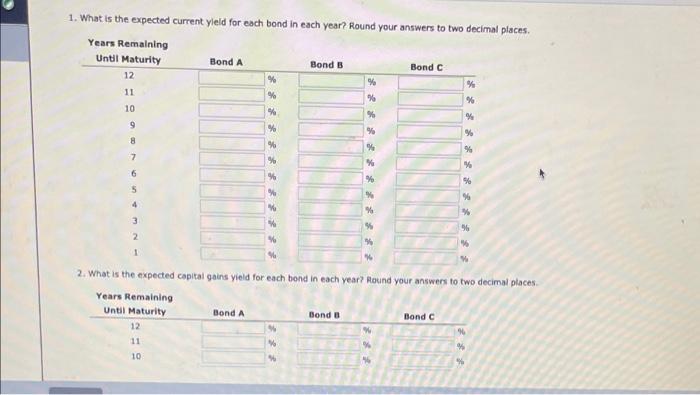
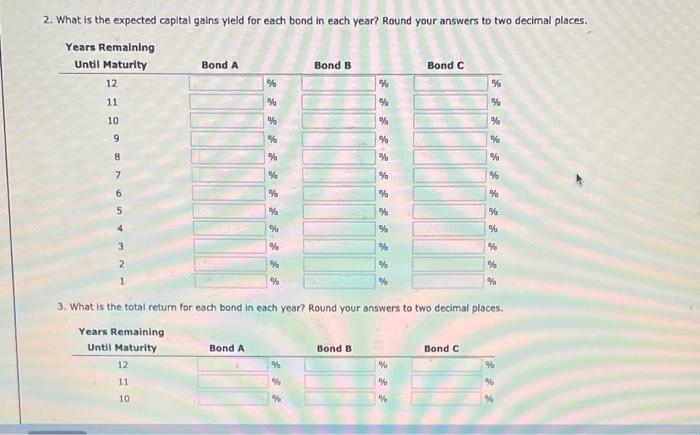
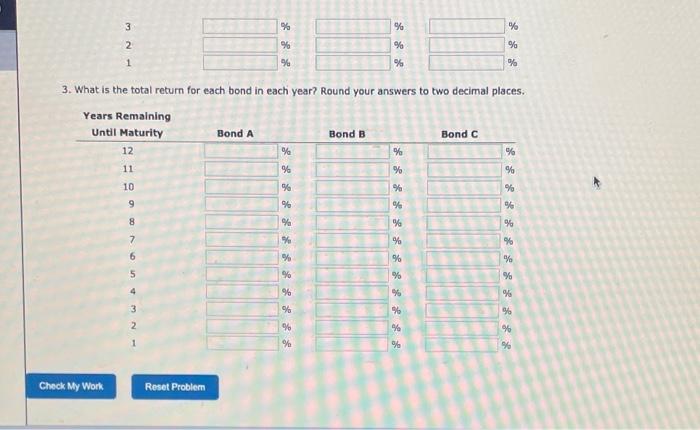
Clifford Clark is a recent retiree who is interested in investing some of his savings in corporate bonds. His financial planner has suggested the following bonds: - Bond A has a 10% annual coupon, matures in 12 years, and has a $1,000 face value. - Bond B has a 6% annual coupon, matures in 12 years, and has a $1,000 face value. - Bond C has an 8% annual coupon, matures in 12 years, and has a $1,000 face value. Each bond has a yleld to maturity of 8%. The data has been collected in the Microsoft Excel file below. Download the spreadsheet and perform the required analysis to answer the questions belov Do not round intermediate calculations. Use a minus sign to enter negative values, if any. If an answer is zero, enter "0;. Downioad spreadsheet Bond Valuation-2fbib x iss a. Before calculating the prices of the bonds, indicate whether each bond is trading at a premium, at a discount, or at par. Bond A is selling at because its coupon rate is the going interest rate. Bond B is seiling at because its coupon rate is the going interest rate. Bond C is selling at because its coupon rate is the going interest rate. b. Calculate the price of each of the three bonds. Round your answers to the nearest cent. Price (BondA):$ Price (Bond B) 5 Price (BandC):5 c. Calculate the current yield for each of the three bonds. (Hint: The expected current yield is calculated as the anriual interest divided by the price of the bond.) Round your answers to two decimal places. Current yleld (Bond A ): Current yield (Bond B): Current yield (Bond C ): d. If the yield to maturity for each bond remains at 8%, what will be the price of each bond 1 year from now? Round your answers to the nearest cent. Price (Bond A):$ Price (Bond B):5 Price (Bond C): 3 What is the expected capital gains yieid for each bond? What is the expected total return for each bond? Round your answers to two decimal piaces. What is the expected capital gains yield for each bond? What is the expected total return for each bond? Round your answers to two decimal places. e. Mr. Clark. is considering another bond, Bond D. It has an 8% semiannual coupon and a $1,000 face value (i.e., it pays a $40 coupon every 6 months). Bond D is scheduled to mature in 9 years and has a price of $1,150. It is also callable in 5 years at a call price of $1,040. 1. What is the bond's nominal yield to maturity? Round your answer to two decimal places. 2. What is the bond's nominal yield to call? Round your answer to two decimal places. 8 3. If Mr. Clark were to purchase this bond, would he be more likely to receive the yieid to maturity or yieid to cali? Explain your answer. Because the YTM is the YTf, Mr. Clark expect the bond to be called. Consequently, he would earn f. Explain brietly the difference between price risk and reinvestment risk. This risk of a decline in bond values due to an increase in interest rates is called The risk of an income decline due to a drop in interest rates is called Which of the following bonds has the most price risk? Which has the most reinvestment risk? - A 1-year bond with an 8% annual coupon - A S-year bond with an 8\% annual coupon - A 5-year bond with a zero coupon - A 10 -year bond with an 8% annual coupon - A 10-year bond with a zero coupon A has the most price risk, A has the most reinvestment risk. 9. Calculate the price of each bond (A,B, and C) at the end of each year until maturity, assuming interest rates remain constant. Round your answers to the nearest cent. Create a graph showing the time path of each bond's value. Choose the correct graph. The correct graph is Create a graph showing the time path of each bond's value. Choose the correct graph. The correct graph is A. C. Time Prath of Bonde A, B, and C. D. Time Path of Bondu A,8, and C 1. What is the expected current yleid far each bond in each year? Pound your answers to two decamal places. 1. What is the expected current yleld for each bond in each year? Round your answers to two decimal places. 2. What is the expected capital goins yield for each bond in each vear? Hound your answers to two decimal places. 2. What is the expected capital gains yield for each bond in each year? Round your answers to two decimal places. 3. What is the total retum for each bond in each year? Round your answers to two decimal places. 3. What is the total return for each bond in each year? Round your answers to two decimal places Step by Step Solution
There are 3 Steps involved in it
Step: 1

Get Instant Access to Expert-Tailored Solutions
See step-by-step solutions with expert insights and AI powered tools for academic success
Step: 2

Step: 3
Ace Your Homework with AI
Get the answers you need in no time with our AI-driven, step-by-step assistance
Get Started
States And The Reemergence Of Global Finance
Authors: Eric Helleiner
1st Edition
0801428599, 978-0801428593