Can you please solve this question using MATLAB ?

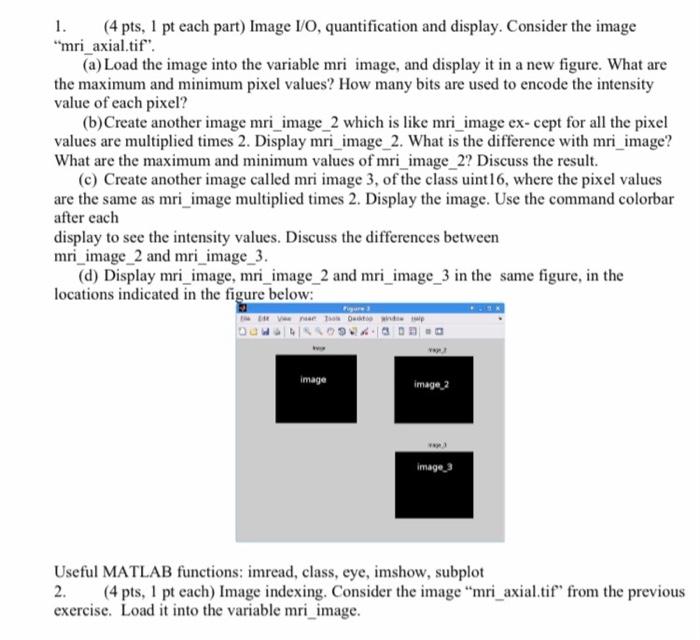
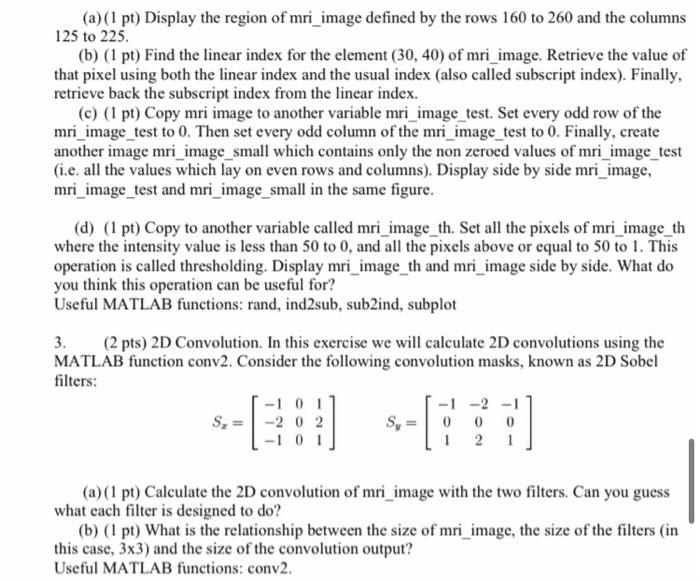
1. (4 pts, 1 pt each part) Image 10, quantification and display. Consider the image "mri_axial.tif". (a) Load the image into the variable mri image, and display it in a new figure. What are the maximum and minimum pixel values? How many bits are used to encode the intensity value of each pixel? (b)Create another image mri_image_2 which is like mri_image ex-cept for all the pixel values are multiplied times 2. Display mri_image_2. What is the difference with mri_image? What are the maximum and minimum values of mri_image_2? Discuss the result. (c) Create another image called mri image 3, of the class uint16, where the pixel values are the same as mri_image multiplied times 2. Display the image. Use the command colorbar after each display to see the intensity values. Discuss the differences between mri_image_2 and mri_image_3. (d) Display mri_image, mri_image_2 and mri_image_3 in the same figure, in the locations indicated in the figure below: image image 2 image_3 Useful MATLAB functions: imread, class, eye, imshow, subplot 2. (4 pts, 1 pt each) Image indexing. Consider the image "mri_axial.tif" from the previous exercise. Load it into the variable mri_image. (a)(1 pt) Display the region of mri_image defined by the rows 160 to 260 and the columns 125 to 225 (b) (1 pt) Find the linear index for the element (30, 40) of mri_image. Retrieve the value of that pixel using both the linear index and the usual index (also called subscript index). Finally, retrieve back the subscript index from the linear index. (c) (1 pt) Copy mri image to another variable mri_image_test. Set every odd row of the mri_image_test to 0. Then set every odd column of the mri_image_test to 0. Finally, create another image mri_image_small which contains only the non zeroed values of mri_image_test (i.e. all the values which lay on even rows and columns). Display side by side mri_image, mri_image_test and mri_image_small in the same figure. (d) (1 pt) Copy to another variable called mri_image_th. Set all the pixels of mri_image_th where the intensity value is less than 50 to 0, and all the pixels above or equal to 50 to 1. This operation is called thresholding. Display mri_image_th and mri_image side by side. What do you think this operation can be useful for? Useful MATLAB functions: rand, ind2sub, sub ind, subplot 3. (2 pts) 2D Convolution. In this exercise we will calculate 2D convolutions using the MATLAB function conv2. Consider the following convolution masks, known as 2D Sobel filters: -1 0 1 -1 -2 -1 -2 0 2 0 0 -101 2 1 0 (a) (1 pt) Calculate the 2D convolution of mri_image with the two filters. Can you guess what each filter is designed to do? (b) (1 pt) What is the relationship between the size of mri_image, the size of the filters (in this case, 3x3) and the size of the convolution output? Useful MATLAB functions: conv2. 1. (4 pts, 1 pt each part) Image 10, quantification and display. Consider the image "mri_axial.tif". (a) Load the image into the variable mri image, and display it in a new figure. What are the maximum and minimum pixel values? How many bits are used to encode the intensity value of each pixel? (b)Create another image mri_image_2 which is like mri_image ex-cept for all the pixel values are multiplied times 2. Display mri_image_2. What is the difference with mri_image? What are the maximum and minimum values of mri_image_2? Discuss the result. (c) Create another image called mri image 3, of the class uint16, where the pixel values are the same as mri_image multiplied times 2. Display the image. Use the command colorbar after each display to see the intensity values. Discuss the differences between mri_image_2 and mri_image_3. (d) Display mri_image, mri_image_2 and mri_image_3 in the same figure, in the locations indicated in the figure below: image image 2 image_3 Useful MATLAB functions: imread, class, eye, imshow, subplot 2. (4 pts, 1 pt each) Image indexing. Consider the image "mri_axial.tif" from the previous exercise. Load it into the variable mri_image. (a)(1 pt) Display the region of mri_image defined by the rows 160 to 260 and the columns 125 to 225 (b) (1 pt) Find the linear index for the element (30, 40) of mri_image. Retrieve the value of that pixel using both the linear index and the usual index (also called subscript index). Finally, retrieve back the subscript index from the linear index. (c) (1 pt) Copy mri image to another variable mri_image_test. Set every odd row of the mri_image_test to 0. Then set every odd column of the mri_image_test to 0. Finally, create another image mri_image_small which contains only the non zeroed values of mri_image_test (i.e. all the values which lay on even rows and columns). Display side by side mri_image, mri_image_test and mri_image_small in the same figure. (d) (1 pt) Copy to another variable called mri_image_th. Set all the pixels of mri_image_th where the intensity value is less than 50 to 0, and all the pixels above or equal to 50 to 1. This operation is called thresholding. Display mri_image_th and mri_image side by side. What do you think this operation can be useful for? Useful MATLAB functions: rand, ind2sub, sub ind, subplot 3. (2 pts) 2D Convolution. In this exercise we will calculate 2D convolutions using the MATLAB function conv2. Consider the following convolution masks, known as 2D Sobel filters: -1 0 1 -1 -2 -1 -2 0 2 0 0 -101 2 1 0 (a) (1 pt) Calculate the 2D convolution of mri_image with the two filters. Can you guess what each filter is designed to do? (b) (1 pt) What is the relationship between the size of mri_image, the size of the filters (in this case, 3x3) and the size of the convolution output? Useful MATLAB functions: conv2


