

Answered step by step
Verified Expert Solution
Question
1 Approved Answer
can you pleasee help me with this. i have attached the financial statement and cash flow statements. hope this will help to find ans Case
can you pleasee help me with this. 
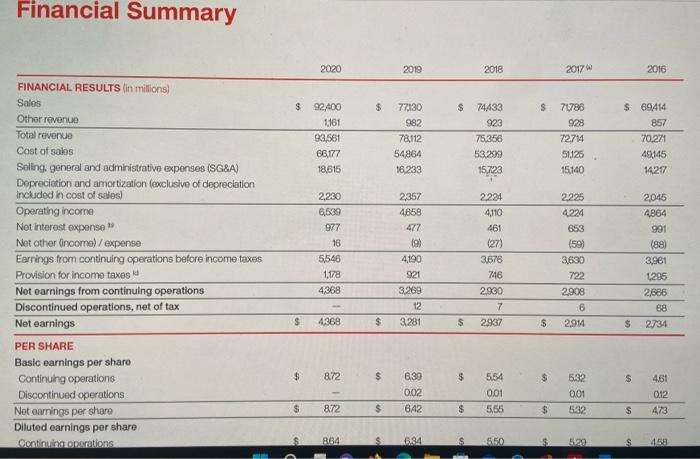
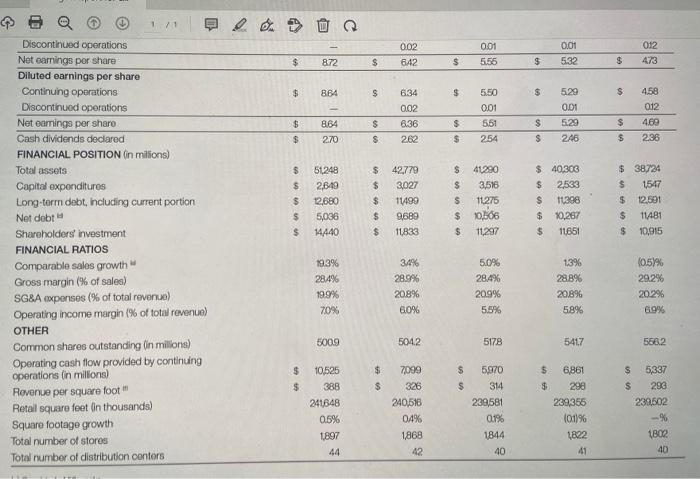
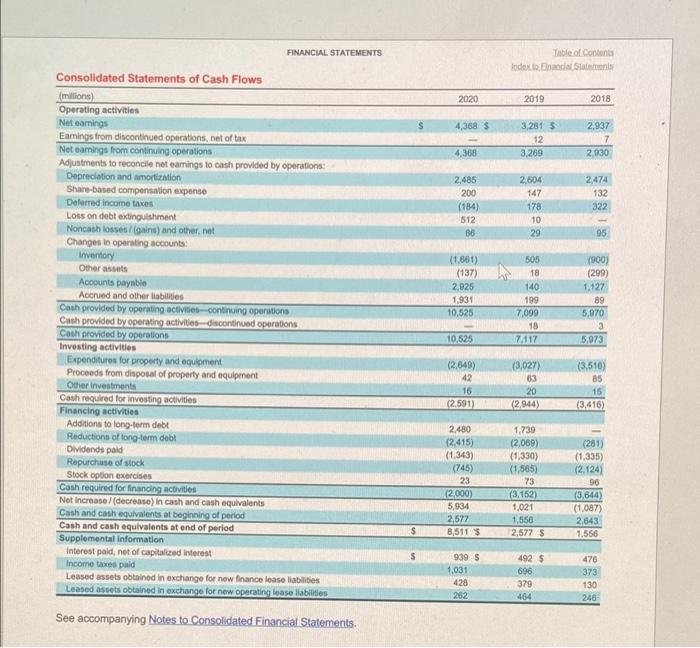
Case 5.37 OLO 5,07,08 Focus company-accounts receivable and inventory disclosures In Exercise 1.1, you were asked to obtain the most recent annual report of a company that you were interested in reviewing throughout this term. Required: Review the note disclosures provided in your focus company's annual report and discuss what you've learned about how your company's accounts receivable and inventory are accounted for and presented. Financial Summary 2020 2019 2018 2017 2016 $ $ S $ 92.400 1161 93,561 66177 18,615 77130 982 78,112 54864 16.233 74433 923 75.356 53.299 71788 928 72714 51125 15,140 $ 69,414 857 70.271 49145 14217 15.723 2357 4658 477 FINANCIAL RESULTS in millions) Sales Other revenue Total revenue Cost of sales Soling general and administrative expenses (SG&A) Depreciation and amortization (exclusive of depreciation included in cost of sales Operating income Not interest expense Net other income) /expense Earnings from continuing operations before income taxes Provision for income taxes Not earnings from continuing operations Discontinued operations, net of tax Net earnings PER SHARE Basic earnings per share Continuing operations Discontinued operations Not earnings per share Diluted earnings per sharo Continuing operations 2.230 6539 977 16 5548 1.178 4368 2224 4110 461 (27) 3,676 2.225 4224 653 (59) 3630 722 2908 6 2914 (9) 4190 921 3.289 12 3281 2,045 4864 991 (88) 3,961 1296 2,686 68 2734 746 2,900 7 2937 $ 4368 $ $ $ $ $ 872 $ $ $ $ 6.30 002 642 554 001 5,55 522 001 4.61 012 473 $ 872 $ $ $ $ 864 6.94 550 529 458 > 0.01 012 002 642 0.01 5.55 $ 872 $ $ 532 $ 473 $ $ $ B64 $ $ 529 $ 6134 002 6.36 2.62 5.50 0.01 551 254 458 012 469 236 864 $ $ $ $ $ ODI 5.29 246 $ $ $ $ 2.70 $ $ $ $ 09 $ $ 51248 2,849 12,880 5,036 14440 $ $ $ $ 42,779 3,027 11499 9689 11,833 $ S $ $ 41290 3,516 11275 10,506 11,297 $ 40,303 $ 2533 $ 16398 $ 10,287 11651 $ 38724 $ 1547 $ 12.591 $ 11481 $ 10,915 S $ Discontinued operations Net earnings por share Diluted earnings per share Continuing operations Discontinued operations Net earnings per sharo Cash dividends declared FINANCIAL POSITION On millions) Total assets Capital expenditures Long-term debt, including current portion Net dobt Shareholders investment FINANCIAL RATIOS Comparable sales growth Gross margin (% of sales) SG&A expenses (% of total revenue) Operating income margin (% of total revenue) OTHER Common shares outstanding in milions) Operating cash flow provided by continuing operations in milions) Revenue per square foot Retail square feet in thousands) Square footage growth Total number of stores Total number of distribution conters 193% 28.4% 19.9% 70% 3.4% 28.9% 20.8% 6.0% 5.0% 28.4% 20.9% 5.5% 13% 28.8% 20.8% 58% (0.5% 29.2% 20.2% 69% 5009 5042 5178 5417 5582 6 6,881 $ $ $ $ $ $ $ 298 $ 5,337 $ 293 239502 10525 388 241648 0.5% 1897 44 7099 326 240516 04% 1868 42 5.970 314 239,581 0.1% 1844 40 239356 101% 1822 41 1800 40 FINANCIAL STATEMENTS Table of Contents Index to Endalas 2020 2019 2018 4,368 3 3.2015 12 3,269 2,937 7 2.930 4368 2.485 200 (184) 512 B6 2,604 147 178 10 29 2.474 132 322 95 (1.061) (137) 2,925 1,931 10,525 Consolidated Statements of Cash Flows millions) Operating activities Net earings Enmings from discontinued operations, net of tax Net camings from continuing operations Adjustments to reconcile net earnings to cash provided by operations: Depreciation and amortization Share-based compensation expense Deferred income taxes Loss on debt extinguishment Noncash losses/gains) and other net Changes in operating accounts: Inventory Other assets Accounts payable Accrued and other liabilities Cash provided by operating activities continuing operations Cash provided by operating activities discontinued operations Cath provided by operations Investing activities Expenditures for property and equipment Proceeds from disposal of property and equipment Other investments Cash required for investing activities Financing activities Additions to long-term debt Reductions of long-term debt Dividends paid Repurchase of stock Stock option exercises Cash required for financing activities Net Increase / (decrease in cash and cash equivalents Cash and cash equivalents at beginning of period Cash and cash equivalents at end of period Supplemental Information Interest pald, net of capitalized interest Income taxes paid Leased assets obtained in exchange for new finance lease liabilities Leased assets obtained in exchange for new operating lease liabilities 505 18 140 199 7,099 18 7.117 (900) (299) 1.127 89 5,070 3 5,073 10.525 (2,649) 42 16 (2.591) (3,027) 63 20 (2,944) (3.510) 85 15 (3.416) 2.480 (2.415) (1.343) (745) 23 (2.000) 5,934 2,577 8,5113 1.739 (2,069) (1,330) (1,565) 73 (3.152) 1,021 1,558 2.577 5 (281) (1.335) (2.124) 96 (3,644) (1,087) 2.643 1.556 $ 939 $ 1,031 428 202 492 $ 696 379 476 373 130 246 See accompanying Notes to Consolidated Financial Statements. Case 5.37 OLO 5,07,08 Focus company-accounts receivable and inventory disclosures In Exercise 1.1, you were asked to obtain the most recent annual report of a company that you were interested in reviewing throughout this term. Required: Review the note disclosures provided in your focus company's annual report and discuss what you've learned about how your company's accounts receivable and inventory are accounted for and presented. Financial Summary 2020 2019 2018 2017 2016 $ $ S $ 92.400 1161 93,561 66177 18,615 77130 982 78,112 54864 16.233 74433 923 75.356 53.299 71788 928 72714 51125 15,140 $ 69,414 857 70.271 49145 14217 15.723 2357 4658 477 FINANCIAL RESULTS in millions) Sales Other revenue Total revenue Cost of sales Soling general and administrative expenses (SG&A) Depreciation and amortization (exclusive of depreciation included in cost of sales Operating income Not interest expense Net other income) /expense Earnings from continuing operations before income taxes Provision for income taxes Not earnings from continuing operations Discontinued operations, net of tax Net earnings PER SHARE Basic earnings per share Continuing operations Discontinued operations Not earnings per share Diluted earnings per sharo Continuing operations 2.230 6539 977 16 5548 1.178 4368 2224 4110 461 (27) 3,676 2.225 4224 653 (59) 3630 722 2908 6 2914 (9) 4190 921 3.289 12 3281 2,045 4864 991 (88) 3,961 1296 2,686 68 2734 746 2,900 7 2937 $ 4368 $ $ $ $ $ 872 $ $ $ $ 6.30 002 642 554 001 5,55 522 001 4.61 012 473 $ 872 $ $ $ $ 864 6.94 550 529 458 > 0.01 012 002 642 0.01 5.55 $ 872 $ $ 532 $ 473 $ $ $ B64 $ $ 529 $ 6134 002 6.36 2.62 5.50 0.01 551 254 458 012 469 236 864 $ $ $ $ $ ODI 5.29 246 $ $ $ $ 2.70 $ $ $ $ 09 $ $ 51248 2,849 12,880 5,036 14440 $ $ $ $ 42,779 3,027 11499 9689 11,833 $ S $ $ 41290 3,516 11275 10,506 11,297 $ 40,303 $ 2533 $ 16398 $ 10,287 11651 $ 38724 $ 1547 $ 12.591 $ 11481 $ 10,915 S $ Discontinued operations Net earnings por share Diluted earnings per share Continuing operations Discontinued operations Net earnings per sharo Cash dividends declared FINANCIAL POSITION On millions) Total assets Capital expenditures Long-term debt, including current portion Net dobt Shareholders investment FINANCIAL RATIOS Comparable sales growth Gross margin (% of sales) SG&A expenses (% of total revenue) Operating income margin (% of total revenue) OTHER Common shares outstanding in milions) Operating cash flow provided by continuing operations in milions) Revenue per square foot Retail square feet in thousands) Square footage growth Total number of stores Total number of distribution conters 193% 28.4% 19.9% 70% 3.4% 28.9% 20.8% 6.0% 5.0% 28.4% 20.9% 5.5% 13% 28.8% 20.8% 58% (0.5% 29.2% 20.2% 69% 5009 5042 5178 5417 5582 6 6,881 $ $ $ $ $ $ $ 298 $ 5,337 $ 293 239502 10525 388 241648 0.5% 1897 44 7099 326 240516 04% 1868 42 5.970 314 239,581 0.1% 1844 40 239356 101% 1822 41 1800 40 FINANCIAL STATEMENTS Table of Contents Index to Endalas 2020 2019 2018 4,368 3 3.2015 12 3,269 2,937 7 2.930 4368 2.485 200 (184) 512 B6 2,604 147 178 10 29 2.474 132 322 95 (1.061) (137) 2,925 1,931 10,525 Consolidated Statements of Cash Flows millions) Operating activities Net earings Enmings from discontinued operations, net of tax Net camings from continuing operations Adjustments to reconcile net earnings to cash provided by operations: Depreciation and amortization Share-based compensation expense Deferred income taxes Loss on debt extinguishment Noncash losses/gains) and other net Changes in operating accounts: Inventory Other assets Accounts payable Accrued and other liabilities Cash provided by operating activities continuing operations Cash provided by operating activities discontinued operations Cath provided by operations Investing activities Expenditures for property and equipment Proceeds from disposal of property and equipment Other investments Cash required for investing activities Financing activities Additions to long-term debt Reductions of long-term debt Dividends paid Repurchase of stock Stock option exercises Cash required for financing activities Net Increase / (decrease in cash and cash equivalents Cash and cash equivalents at beginning of period Cash and cash equivalents at end of period Supplemental Information Interest pald, net of capitalized interest Income taxes paid Leased assets obtained in exchange for new finance lease liabilities Leased assets obtained in exchange for new operating lease liabilities 505 18 140 199 7,099 18 7.117 (900) (299) 1.127 89 5,070 3 5,073 10.525 (2,649) 42 16 (2.591) (3,027) 63 20 (2,944) (3.510) 85 15 (3.416) 2.480 (2.415) (1.343) (745) 23 (2.000) 5,934 2,577 8,5113 1.739 (2,069) (1,330) (1,565) 73 (3.152) 1,021 1,558 2.577 5 (281) (1.335) (2.124) 96 (3,644) (1,087) 2.643 1.556 $ 939 $ 1,031 428 202 492 $ 696 379 476 373 130 246 See accompanying Notes to Consolidated Financial Statements i have attached the financial statement and cash flow statements.
hope this will help to find ans
Step by Step Solution
There are 3 Steps involved in it
Step: 1

Get Instant Access to Expert-Tailored Solutions
See step-by-step solutions with expert insights and AI powered tools for academic success
Step: 2

Step: 3
Ace Your Homework with AI
Get the answers you need in no time with our AI-driven, step-by-step assistance
Get Started
Accounting
Authors: Jonathan E. Duchac, James M. Reeve, Carl S. Warren
23rd Edition
978-0324662962