

Answered step by step
Verified Expert Solution
Question
1 Approved Answer
Can you Plot the Graph in Excel with those expression please. A renewable energy electricity supply technology has the following characteristics: Lifetime (years) Salvage value
Can you Plot the Graph in Excel with those expression please.
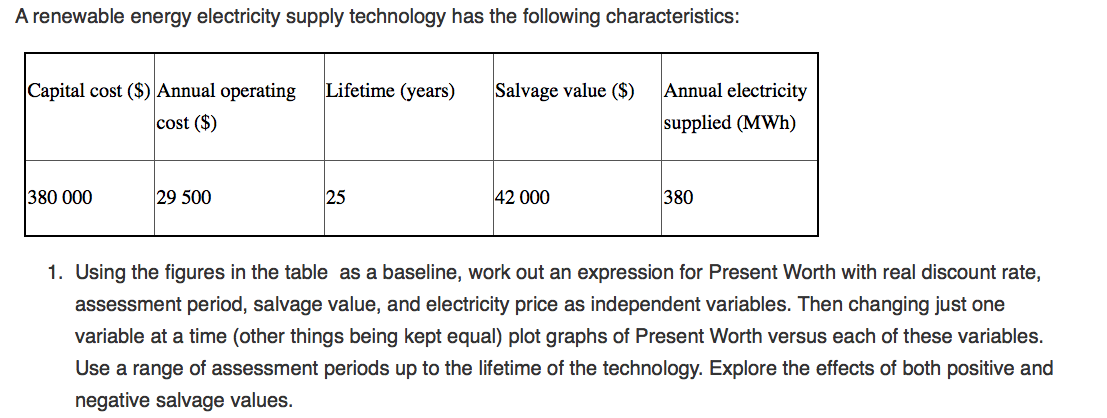
A renewable energy electricity supply technology has the following characteristics: Lifetime (years) Salvage value ($) Capital cost ($) Annual operating cost ($) Annual electricity supplied (MWh) 380 000 29 500 42 000 80 1. Using the figures in the table as a baseline, work out an expression for Present Worth with real discount rate, assessment period, salvage value, and electricity price as independent variables. Then changing just one variable at a time (other things being kept equal) plot graphs of Present Worth versus each of these variables. Use a range of assessment periods up to the lifetime of the technology. Explore the effects of both positive and negative salvage values. A renewable energy electricity supply technology has the following characteristics: Lifetime (years) Salvage value ($) Capital cost ($) Annual operating cost ($) Annual electricity supplied (MWh) 380 000 29 500 42 000 80 1. Using the figures in the table as a baseline, work out an expression for Present Worth with real discount rate, assessment period, salvage value, and electricity price as independent variables. Then changing just one variable at a time (other things being kept equal) plot graphs of Present Worth versus each of these variables. Use a range of assessment periods up to the lifetime of the technology. Explore the effects of both positive and negative salvage valuesStep by Step Solution
There are 3 Steps involved in it
Step: 1

Get Instant Access to Expert-Tailored Solutions
See step-by-step solutions with expert insights and AI powered tools for academic success
Step: 2

Step: 3
Ace Your Homework with AI
Get the answers you need in no time with our AI-driven, step-by-step assistance
Get Started
Stock Trading $Trategies For Self Directed Beginners
Authors: J.r. Zordi
1st Edition
1542378230, 978-1542378239