

Question
Can you run a time series analysis in R studio? Please plot this when the x-value is the date, or the day and y is
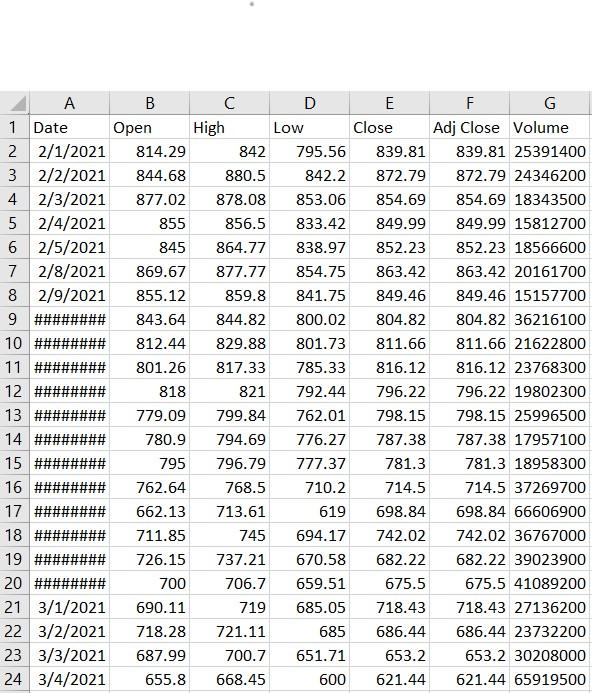
Can you run a time series analysis in R studio? Please plot this when the x-value is the date, or the day and y is the closing time. I imported this data as an excel document. Also this data is from tesla stock over a span of 24 days.
A B C D E F G 1 Date Open High Low Close Adj Close Volume 2 2/1/2021 814.29 842 795.56 839.81 839.81 25391400 3 2/2/2021 844.68 880.5 842.2 872.79 872.79 24346200 4 2/3/2021 877.02 878.08 853.06 854.69 854.69 18343500 5 2/4/2021 855 856.5 833.42 849.99 849.99 15812700 6 2/5/2021 845 864.77 838.97 852.23 852.23 18566600 7 2/8/2021 869.67 877.77 854.75 863.42 863.42 20161700 8 2/9/2021 855.12 859.8 841.75 849.46 849.46 15157700 9 ######## 843.64 844.82 800.02 804.82 804.82 36216100 10 ### 812.44 829.88 801.73 811.66 811.66 21622800 11 801.26 817.33 785.33 816.12 816.12 23768300 12 818 821 792.44 796.22 796.22 19802300 13 779.09 799.84 762.01 798.15 798.15 25996500 14 780.9 794.69 776.27 787.38 787.38 17957100 15 795 796.79 777.37 781.3 781.3 18958300 16 762.64 768.5 710.2 714.5 714.5 37269700 17 662.13 713.61 619 698.84 698.84 66606900 18 711.85 745 694.17 742.02 742.02 36767000 19 726.15 737.21 670.58 682.22 682.22 39023900 20 #### 700 706.7 659.51 675.5 675.5 41089200 21 3/1/2021 690.11 719 685.05 718.43 718.43 27136200 22 3/2/2021 718.28 721.11 685 686.44 686.44 23732200 23 3/3/2021 687.99 700.7 651.71 653.2 653.2 30208000 24 3/4/2021 655.8 668.45 600 621.44 621.44 65919500 A B C D E F G 1 Date Open High Low Close Adj Close Volume 2 2/1/2021 814.29 842 795.56 839.81 839.81 25391400 3 2/2/2021 844.68 880.5 842.2 872.79 872.79 24346200 4 2/3/2021 877.02 878.08 853.06 854.69 854.69 18343500 5 2/4/2021 855 856.5 833.42 849.99 849.99 15812700 6 2/5/2021 845 864.77 838.97 852.23 852.23 18566600 7 2/8/2021 869.67 877.77 854.75 863.42 863.42 20161700 8 2/9/2021 855.12 859.8 841.75 849.46 849.46 15157700 9 ######## 843.64 844.82 800.02 804.82 804.82 36216100 10 ### 812.44 829.88 801.73 811.66 811.66 21622800 11 801.26 817.33 785.33 816.12 816.12 23768300 12 818 821 792.44 796.22 796.22 19802300 13 779.09 799.84 762.01 798.15 798.15 25996500 14 780.9 794.69 776.27 787.38 787.38 17957100 15 795 796.79 777.37 781.3 781.3 18958300 16 762.64 768.5 710.2 714.5 714.5 37269700 17 662.13 713.61 619 698.84 698.84 66606900 18 711.85 745 694.17 742.02 742.02 36767000 19 726.15 737.21 670.58 682.22 682.22 39023900 20 #### 700 706.7 659.51 675.5 675.5 41089200 21 3/1/2021 690.11 719 685.05 718.43 718.43 27136200 22 3/2/2021 718.28 721.11 685 686.44 686.44 23732200 23 3/3/2021 687.99 700.7 651.71 653.2 653.2 30208000 24 3/4/2021 655.8 668.45 600 621.44 621.44 65919500Step by Step Solution
There are 3 Steps involved in it
Step: 1

Get Instant Access to Expert-Tailored Solutions
See step-by-step solutions with expert insights and AI powered tools for academic success
Step: 2

Step: 3
Ace Your Homework with AI
Get the answers you need in no time with our AI-driven, step-by-step assistance
Get Started
Spatial Databases A Tour
Authors: Shashi Shekhar, Sanjay Chawla
1st Edition
0130174807, 978-0130174802