

Answered step by step
Verified Expert Solution
Question
1 Approved Answer
Can you see it now? Could you please help me about the 4, 5 and 6? I have marked them with red circles. Thanks in
 Can you see it now?
Could you please help me about the 4, 5 and 6? I have marked them with red circles. Thanks in advance.
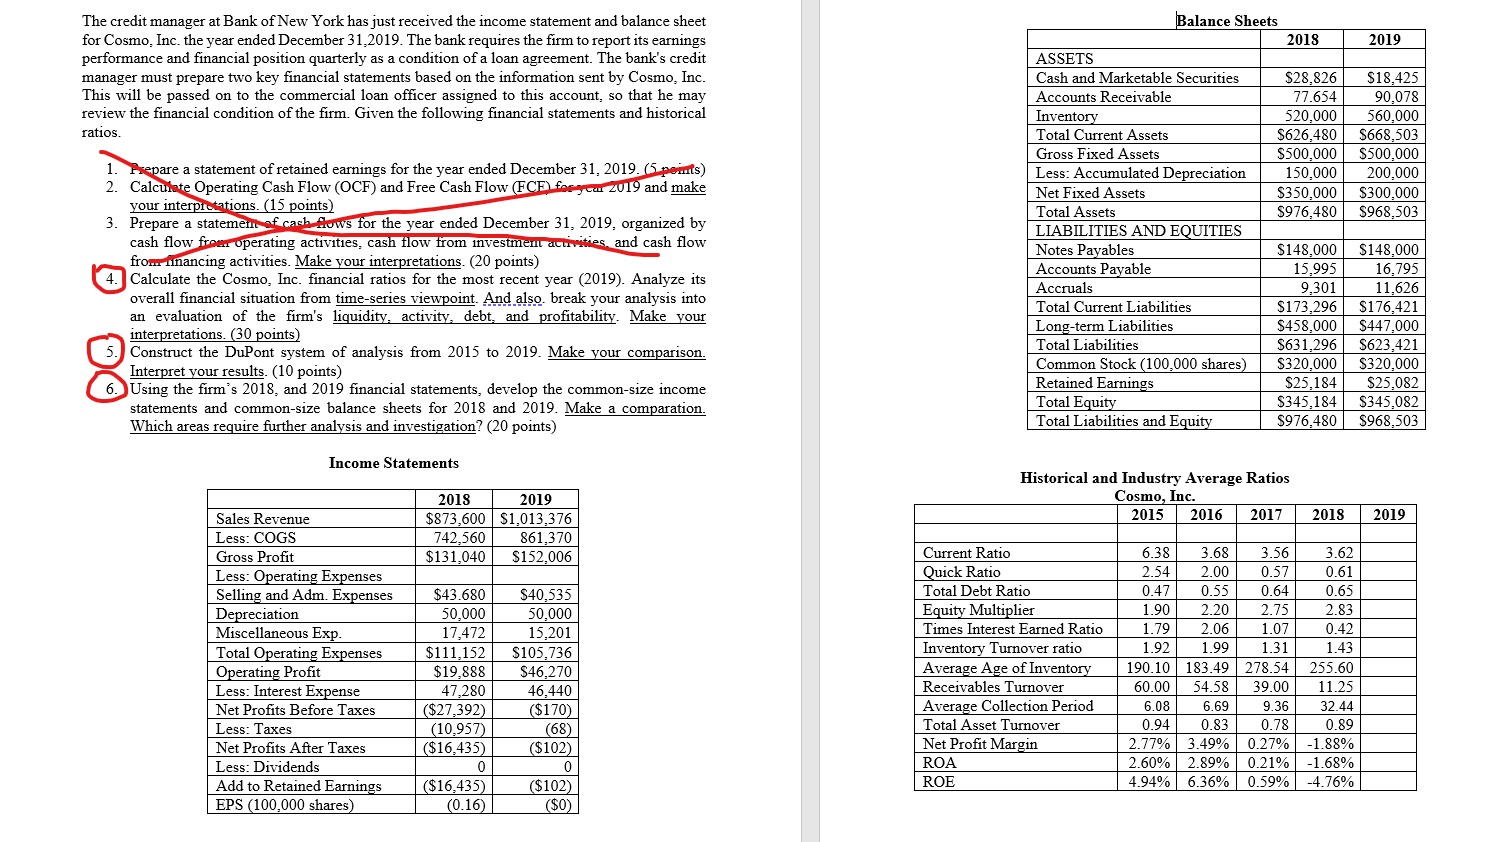
Balance Sheets 2018 2019 The credit manager at Bank of New York has just received the income statement and balance sheet for Cosmo. Inc. the year ended December 31,2019. The bank requires the firm to report its earnings performance and financial position quarterly as a condition of a loan agreement. The bank's credit manager must prepare two key financial statements based on the information sent by Cosmo, Inc. This will be passed on to the commercial loan officer assigned to this account, so that he may review the financial condition of the firm. Given the following financial statements and historical ratios. $28,826 77.654 520,000 $626,480 $500,000 150,000 $350,000 $976,480 $18.425 90,078 560,000 $668,503 $500,000 200,000 $300,000 $968,503 1. Prepare a statement of retained earnings for the year ended December 31, 2019. 6.poms) 2. Calculate Operating Cash Flow (OCF) and Free Cash Flow (FCE) for you 2019 and make your interpretations. (15 points) 3. Prepare a statement of cash Aows for the year ended December 31, 2019, organized by cash flow frour operating activities, cash flow from investment activities and cash flow from financing activities. Make your interpretations. (20 points) 4. Calculate the Cosmo, Inc. financial ratios for the most recent year (2019). Analyze its overall financial situation from time-series viewpoint. And also break your analysis into an evaluation of the firm's liquidity, activity, debt, and profitability. Make your interpretations. (30 points) 5. Construct the DuPont system of analysis from 2015 to 2019. Make your comparison. Interpret your results. (10 points) 6. Using the firm's 2018, and 2019 financial statements, develop the common-size income statements and common-size balance sheets for 2018 and 2019. Make a comparation. Which areas require further analysis and investigation? (20 points) ASSETS Cash and Marketable Securities Accounts Receivable Inventory Total Current Assets Gross Fixed Assets Less: Accumulated Depreciation Net Fixed Assets Total Assets LIABILITIES AND EQUITIES Notes Payables Accounts Payable Accruals Total Current Liabilities Long-term Liabilities Total Liabilities Common Stock (100,000 shares) Retained Earnings Total Equity Total Liabilities and Equity $148,000 15,995 9,301 $173.296 $458.000 $631,296 $320,000 $25.184 $345,184 $976,480 $148,000 16,795 11.626 $176,421 $447,000 $623,421 $320,000 $25,082 $345,082 $968,503 Income Statements 2018 Historical and Industry Average Ratios Cosmo, Inc. 2015 2016 2017 2018 2019 2019 $873,600 $1,013,376 742,560 861.370 $131,040 $152,006 Sales Revenue Less: COGS Gross Profit Less: Operating Expenses Selling and Adm. Expenses Depreciation Miscellaneous Exp. Total Operating Expenses Operating Profit Less: Interest Expense Net Profits Before Taxes Less: Taxes Net Profits After Taxes Less: Dividends Add to Retained Earnings EPS (100,000 shares) $43.680 50,000 17,472 $111.152 $19,888 47,280 ($27,392) (10,957) ($16,435) 0 ($16,435) (0.16) $40,535 50.000 15,201 $105,736 $46,270 46,440 ($170) (68) ($102) 0 ($102) ($0) Current Ratio Quick Ratio Total Debt Ratio Equity Multiplier Times Interest Earned Ratio Inventory Turnover ratio Average Age of Inventory Receivables Turnover Average Collection Period Total Asset Turnover Net Profit Margin ROA ROE 6.38 3.68 3.56 3.62 2.54 2.00 0.57 0.61 0.47 0.55 0.64 0.65 1.90 2.20 2.75 2.83 1.79 2.06 1.07 0.42 1.92 1.99 1.31 1.43 190.10 | 183.49 278.54 255.60 60.00 54.58 39.00 11.25 6.08 6.69 9.36 32.44 0.94 0.83 0.78 0.89 2.77% 3.49% 0.27% -1.88% 2.60% 2.89% 0.21% -1.68% 4.94% 6.36% 0.59% -4.76% Balance Sheets 2018 2019 The credit manager at Bank of New York has just received the income statement and balance sheet for Cosmo. Inc. the year ended December 31,2019. The bank requires the firm to report its earnings performance and financial position quarterly as a condition of a loan agreement. The bank's credit manager must prepare two key financial statements based on the information sent by Cosmo, Inc. This will be passed on to the commercial loan officer assigned to this account, so that he may review the financial condition of the firm. Given the following financial statements and historical ratios. $28,826 77.654 520,000 $626,480 $500,000 150,000 $350,000 $976,480 $18.425 90,078 560,000 $668,503 $500,000 200,000 $300,000 $968,503 1. Prepare a statement of retained earnings for the year ended December 31, 2019. 6.poms) 2. Calculate Operating Cash Flow (OCF) and Free Cash Flow (FCE) for you 2019 and make your interpretations. (15 points) 3. Prepare a statement of cash Aows for the year ended December 31, 2019, organized by cash flow frour operating activities, cash flow from investment activities and cash flow from financing activities. Make your interpretations. (20 points) 4. Calculate the Cosmo, Inc. financial ratios for the most recent year (2019). Analyze its overall financial situation from time-series viewpoint. And also break your analysis into an evaluation of the firm's liquidity, activity, debt, and profitability. Make your interpretations. (30 points) 5. Construct the DuPont system of analysis from 2015 to 2019. Make your comparison. Interpret your results. (10 points) 6. Using the firm's 2018, and 2019 financial statements, develop the common-size income statements and common-size balance sheets for 2018 and 2019. Make a comparation. Which areas require further analysis and investigation? (20 points) ASSETS Cash and Marketable Securities Accounts Receivable Inventory Total Current Assets Gross Fixed Assets Less: Accumulated Depreciation Net Fixed Assets Total Assets LIABILITIES AND EQUITIES Notes Payables Accounts Payable Accruals Total Current Liabilities Long-term Liabilities Total Liabilities Common Stock (100,000 shares) Retained Earnings Total Equity Total Liabilities and Equity $148,000 15,995 9,301 $173.296 $458.000 $631,296 $320,000 $25.184 $345,184 $976,480 $148,000 16,795 11.626 $176,421 $447,000 $623,421 $320,000 $25,082 $345,082 $968,503 Income Statements 2018 Historical and Industry Average Ratios Cosmo, Inc. 2015 2016 2017 2018 2019 2019 $873,600 $1,013,376 742,560 861.370 $131,040 $152,006 Sales Revenue Less: COGS Gross Profit Less: Operating Expenses Selling and Adm. Expenses Depreciation Miscellaneous Exp. Total Operating Expenses Operating Profit Less: Interest Expense Net Profits Before Taxes Less: Taxes Net Profits After Taxes Less: Dividends Add to Retained Earnings EPS (100,000 shares) $43.680 50,000 17,472 $111.152 $19,888 47,280 ($27,392) (10,957) ($16,435) 0 ($16,435) (0.16) $40,535 50.000 15,201 $105,736 $46,270 46,440 ($170) (68) ($102) 0 ($102) ($0) Current Ratio Quick Ratio Total Debt Ratio Equity Multiplier Times Interest Earned Ratio Inventory Turnover ratio Average Age of Inventory Receivables Turnover Average Collection Period Total Asset Turnover Net Profit Margin ROA ROE 6.38 3.68 3.56 3.62 2.54 2.00 0.57 0.61 0.47 0.55 0.64 0.65 1.90 2.20 2.75 2.83 1.79 2.06 1.07 0.42 1.92 1.99 1.31 1.43 190.10 | 183.49 278.54 255.60 60.00 54.58 39.00 11.25 6.08 6.69 9.36 32.44 0.94 0.83 0.78 0.89 2.77% 3.49% 0.27% -1.88% 2.60% 2.89% 0.21% -1.68% 4.94% 6.36% 0.59% -4.76%Step by Step Solution
There are 3 Steps involved in it
Step: 1

Get Instant Access to Expert-Tailored Solutions
See step-by-step solutions with expert insights and AI powered tools for academic success
Step: 2

Step: 3
Ace Your Homework with AI
Get the answers you need in no time with our AI-driven, step-by-step assistance
Get Started
SAP S/4HANA Financial Accounting Certification Guide
Authors: Stefanos Pougkas
1st Edition
1493215507, 978-1493215508