

Answered step by step
Verified Expert Solution
Question
1 Approved Answer
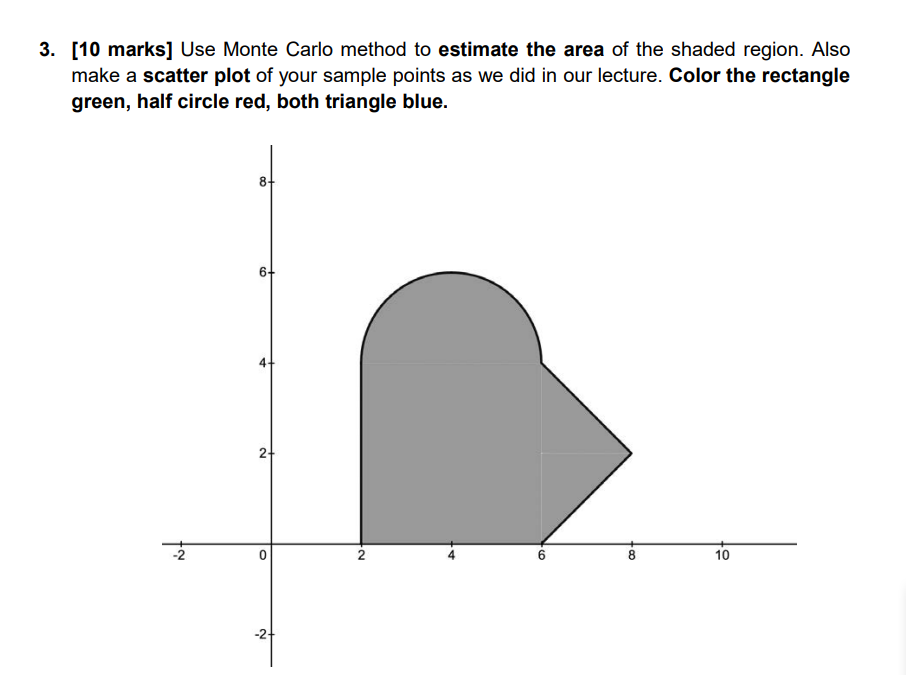
Can you send me full source code in python? So that I can run on colab? [ 1 0 marks ] Use Monte Carlo method
Can you send me full source code in python? So that I can run on colab? marks Use Monte Carlo method to estimate the area of the shaded region. Also
make a scatter plot of your sample points as we did in our lecture. Color the rectangle
green, half circle red, both triangle blue.
I did it but there is a problem on this code for the triangle part please make correction and give me full code
import numpy as np
import matplotlib.pyplot as plt
def estimateareanumsamples:
pointsinsiderectangle
pointsinsidehalfcircle
pointsinsidetriangle
pointstotal numsamples
for in rangenumsamples:
x nprandom.uniform
y nprandom.uniform
# Check if point is inside the green rectangle
if x and x and y and y :
pointsinsiderectangle
# Check if point is inside the upper semicircle
elif x y and y :
pointsinsidehalfcircle
# Check if point is inside the triangle
elif x and x and y and y and y x and y x :
pointsinsidetriangle
# Estimate area
totalarea
shadedarea totalarea pointsinsiderectangle pointsinsidehalfcircle pointsinsidetriangle pointstotal
return shadedarea
def plotpointsnumsamples:
xrectangleinside
yrectangleinside
xhalfcircleinside
yhalfcircleinside
xtriangleinside
ytriangleinside
for in rangenumsamples:
x nprandom.uniform
y nprandom.uniform
if x and x and y and y :
xrectangleinside.appendx
yrectangleinside.appendy
elif x y and y :
xhalfcircleinside.appendx
yhalfcircleinside.appendy
elif x and x and y and y and y x and y x :
xtriangleinside.appendx
ytriangleinside.appendy
pltfigurefigsize
pltscatterxrectangleinside, yrectangleinside, color'green', label'Rectangle Inside'
pltscatterxhalfcircleinside, yhalfcircleinside, color'red', label'Half Circle Inside'
pltscatterxtriangleinside, ytriangleinside, color'blue', label'Triangle Inside'
# Plot rectangle
rectpoints nparray
pltplotrectpoints: rectpoints: color'green', label'Rectangle'
# Plot upper semicircle
theta nplinspace nppi
circlex npcostheta
circley npsintheta
pltplotcirclex circley color'red', label'Upper Semicircle'
# Plot triangle
trianglepoints nparray
pltplottrianglepoints: trianglepoints: color'blue', label'Triangle'
pltxlimy
pltylim
pltxlabelX
pltylabelY
plttitleMonte Carlo Method Sample Points'
pltlegend
pltshow
# Number of samples
numsamples
# Estimate area
estimatedarea estimateareanumsamples
printEstimated area of shaded region:", estimatedarea
# Plot sample points
plotpointsnumsamples
Step by Step Solution
There are 3 Steps involved in it
Step: 1

Get Instant Access to Expert-Tailored Solutions
See step-by-step solutions with expert insights and AI powered tools for academic success
Step: 2

Step: 3
Ace Your Homework with AI
Get the answers you need in no time with our AI-driven, step-by-step assistance
Get Started
Database And Expert Systems Applications 22nd International Conference Dexa 2011 Toulouse France August/September 2011 Proceedings Part 1 Lncs 6860
Authors: Abdelkader Hameurlain ,Stephen W. Liddle ,Klaus-Dieter Schewe ,Xiaofang Zhou
2011th Edition
3642230873, 978-3642230875