

Answered step by step
Verified Expert Solution
Question
1 Approved Answer
Can you show the solution in Excel? 2. After Computer course examination, your lecturer wants to classify a group of students according to the requirements
Can you show the solution in Excel?
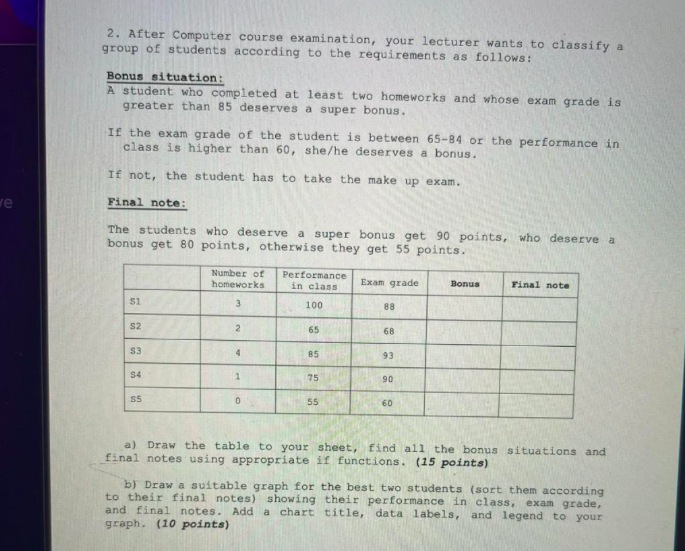
2. After Computer course examination, your lecturer wants to classify a group of students according to the requirements as follows: Bonus situation: A student who completed at least two homeworks and whose exam grade is greater than 85 deserves a super bonus. If the exam grade of the student is between 6584 or the performance in class is higher than 60 , she/he deserves a bonus. If not, the student has to take the make up exam. Final note: The students who deserve a super bonus get 90 points, who deserve a bonus get 80 points, otherwise they get 55 points. a) Draw the table to your sheet, find all the bonus situations and final notes using appropriate if functions. (15 points) b) Draw a suitable graph for the best two students (sort them according to their final notes) showing their performance in class, exam grade, and final notes. Add a chart title, data labels, and legend to your graph. (10 points) 2. After Computer course examination, your lecturer wants to classify a group of students according to the requirements as follows: Bonus situation: A student who completed at least two homeworks and whose exam grade is greater than 85 deserves a super bonus. If the exam grade of the student is between 6584 or the performance in class is higher than 60 , she/he deserves a bonus. If not, the student has to take the make up exam. Final note: The students who deserve a super bonus get 90 points, who deserve a bonus get 80 points, otherwise they get 55 points. a) Draw the table to your sheet, find all the bonus situations and final notes using appropriate if functions. (15 points) b) Draw a suitable graph for the best two students (sort them according to their final notes) showing their performance in class, exam grade, and final notes. Add a chart title, data labels, and legend to your graph. (10 points)Step by Step Solution
There are 3 Steps involved in it
Step: 1

Get Instant Access to Expert-Tailored Solutions
See step-by-step solutions with expert insights and AI powered tools for academic success
Step: 2

Step: 3
Ace Your Homework with AI
Get the answers you need in no time with our AI-driven, step-by-step assistance
Get Started
Understanding Oracle APEX 5 Application Development
Authors: Edward Sciore
2nd Edition
1484209893, 9781484209899