can you tell thd steps to do this. the data itself is too big to post so if you can share the steps
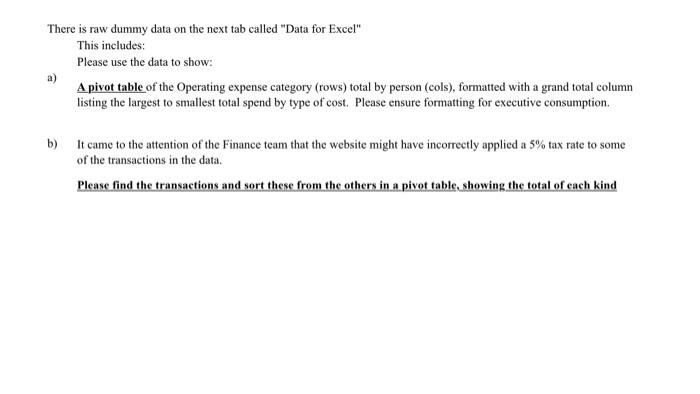
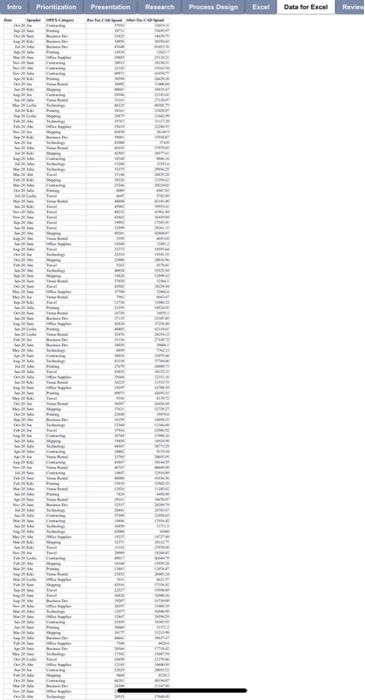
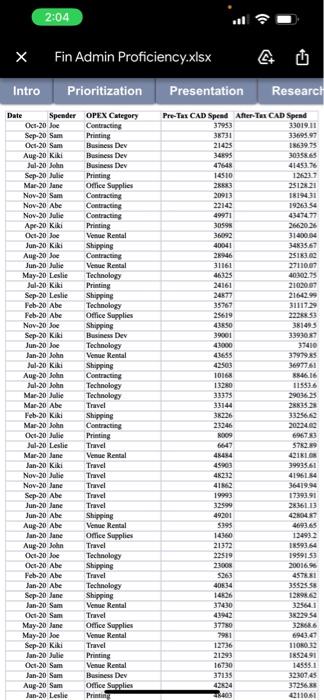
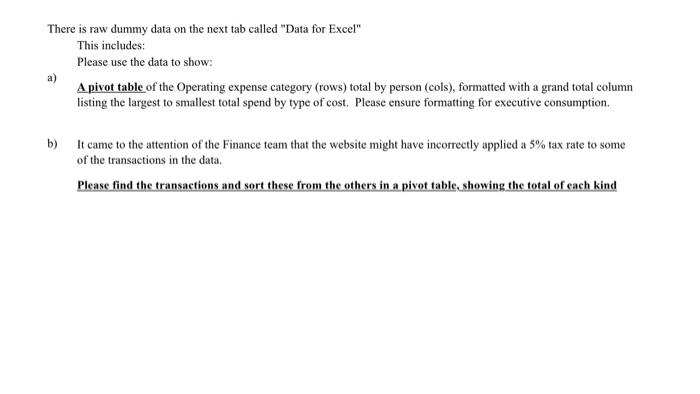
There is raw dummy data on the next tab called "Data for Excel" This includes: Please use the data to show: A pivot table of the Operating expense category (rows) total by person (cols), formatted with a grand total column listing the largest to smallest total spend by type of cost. Please ensure formatting for executive consumption. b) It came to the attention of the Finance team that the website might have incorrectly applied a 5% tax rate to some of the transactions in the data. Please find the transactions and sort these from the others in a pivot table, showing the total of each kind Intro Prioritization Presentation Research Process Design MAT hom TH FORE JTW MAL MIE www www 20 M ww www. HM A KON H W Jost www www PAR NO HRE Excel Data for Excel Review X Intro Date 2:04 Fin Admin Proficiency.xlsx Prioritization Spender OPEX Category Contracting Printing Business Dev Business Dev Business Dev Printing Office Supplies Contracting Contracting Contracting Printing Venue Rental Shipping Contracting Venue Rental Technology Printing Shipping Technology Office Supplies Shipping Business Dev Technology Venue Rental Shipping Contracting Technology Technology Travel Shipping Contracting Printing Travel Venue Rental Travel Travel Travel Travel Travel Shipping Venue Rental Office Supplies Travel Technology Shipping Travel Technology Shipping Venue Rental Travel Office Supplies Venue Rental Travel Printing Venue Rental Business Dev Office Supplies Printing Oct-20 Joe Sep-20 Sam Oct-20 Sam Aug-20 Kiki Jul-20 John Sep-20 Julie Mar-20 Jane Nov-20 Sam Nov-20 Abe Nov-20 Julie Apr-20 Kiki Oct-20 Joe Jun-20 Kiki Aug-20 Joe Jun-20 Julie May-20 Leslie Jul-20 Kiki Sep-20 Leslie Feb-20 Abe Feb-20 Abe Nov-20 Joe Sep-20 Kiki Jun-20 Joe Jan-20 John Jul-20 Kiki Aug-20 John Jul-20 John Mar-20 Julie Mar-20 Abe Feb-20 Kiki Mar-20 John Oct-20 Julie Jul-20 Leslie Mar-20 Jane Jan-20 Kiki Nov-20 Julie Nov-20 Jane Sep-20 Abe Jun-20 Jane Jun-20 Abe Aug-20 Abe Jan-20 Jane Aug-20 John Oct-20 Jo Oct-20 Abe Feb-20 Abe Jan-20 Abe Sep-20 Jane Jan-20 Sam Oct-20 Sam May-20 Jane May-20 Joe Sep-20 Kiki Jan-20 Julie Oct-20 Sam Jan-20 Sam Aug-20 Sam Jan-20 Leslie Presentation Pre-Tax CAD Spend After-Tax CAD Spend 37953 33019.11 38731 33695.97 21425 18639.75 34895 30358.65 47648 41453.76 14510 12623.7 28883 25128.21 20913 18194.31 22142 19263.54 49971 43474.77 30598 26620.26 36092 31400.04 40041 34835.67 28946 25183.02 31161 27110.07 46325 40302.75 24161 21020.07 24877 21642.99 35767 31117.29 25619 22288.53 43850 381495 39001 3393087 43000 37410 43655 37979.85 42503 36977.61 10168 8846.16 13280 11553.6 33375 29036.25 33144 28835.28 38226 3325662 23246 20224.02 8009 6967.83 6647 5782.89 42181.08 39935.61 41961.84 36419.94 17393.91 28361.13 4280487 4693.65 12493.2 18593.64 19591.53 20016.96 4578.81 35525.58 12898.62 32564.1 38229.54 328686 6943.47 11080.32 18524.91 14555.1 32307,45 37256.88 4211061 Research 48484 45903 48232 41862 19993 32599 49201 5395 14360 21372 22519 23008 5263 40834 14826 37430 43942 37780 7981 12736 21293 16730 37135 42824 48403 There is raw dummy data on the next tab called "Data for Excel" This includes: Please use the data to show: A pivot table of the Operating expense category (rows) total by person (cols), formatted with a grand total column listing the largest to smallest total spend by type of cost. Please ensure formatting for executive consumption. b) It came to the attention of the Finance team that the website might have incorrectly applied a 5% tax rate to some of the transactions in the data. Please find the transactions and sort these from the others in a pivot table, showing the total of each kind There is raw dummy data on the next tab called "Data for Excel" This includes: Please use the data to show: A pivot table of the Operating expense category (rows) total by person (cols), formatted with a grand total column listing the largest to smallest total spend by type of cost. Please ensure formatting for executive consumption. b) It came to the attention of the Finance team that the website might have incorrectly applied a 5% tax rate to some of the transactions in the data. Please find the transactions and sort these from the others in a pivot table, showing the total of each kind Intro Prioritization Presentation Research Process Design MAT hom TH FORE JTW MAL MIE www www 20 M ww www. HM A KON H W Jost www www PAR NO HRE Excel Data for Excel Review X Intro Date 2:04 Fin Admin Proficiency.xlsx Prioritization Spender OPEX Category Contracting Printing Business Dev Business Dev Business Dev Printing Office Supplies Contracting Contracting Contracting Printing Venue Rental Shipping Contracting Venue Rental Technology Printing Shipping Technology Office Supplies Shipping Business Dev Technology Venue Rental Shipping Contracting Technology Technology Travel Shipping Contracting Printing Travel Venue Rental Travel Travel Travel Travel Travel Shipping Venue Rental Office Supplies Travel Technology Shipping Travel Technology Shipping Venue Rental Travel Office Supplies Venue Rental Travel Printing Venue Rental Business Dev Office Supplies Printing Oct-20 Joe Sep-20 Sam Oct-20 Sam Aug-20 Kiki Jul-20 John Sep-20 Julie Mar-20 Jane Nov-20 Sam Nov-20 Abe Nov-20 Julie Apr-20 Kiki Oct-20 Joe Jun-20 Kiki Aug-20 Joe Jun-20 Julie May-20 Leslie Jul-20 Kiki Sep-20 Leslie Feb-20 Abe Feb-20 Abe Nov-20 Joe Sep-20 Kiki Jun-20 Joe Jan-20 John Jul-20 Kiki Aug-20 John Jul-20 John Mar-20 Julie Mar-20 Abe Feb-20 Kiki Mar-20 John Oct-20 Julie Jul-20 Leslie Mar-20 Jane Jan-20 Kiki Nov-20 Julie Nov-20 Jane Sep-20 Abe Jun-20 Jane Jun-20 Abe Aug-20 Abe Jan-20 Jane Aug-20 John Oct-20 Jo Oct-20 Abe Feb-20 Abe Jan-20 Abe Sep-20 Jane Jan-20 Sam Oct-20 Sam May-20 Jane May-20 Joe Sep-20 Kiki Jan-20 Julie Oct-20 Sam Jan-20 Sam Aug-20 Sam Jan-20 Leslie Presentation Pre-Tax CAD Spend After-Tax CAD Spend 37953 33019.11 38731 33695.97 21425 18639.75 34895 30358.65 47648 41453.76 14510 12623.7 28883 25128.21 20913 18194.31 22142 19263.54 49971 43474.77 30598 26620.26 36092 31400.04 40041 34835.67 28946 25183.02 31161 27110.07 46325 40302.75 24161 21020.07 24877 21642.99 35767 31117.29 25619 22288.53 43850 381495 39001 3393087 43000 37410 43655 37979.85 42503 36977.61 10168 8846.16 13280 11553.6 33375 29036.25 33144 28835.28 38226 3325662 23246 20224.02 8009 6967.83 6647 5782.89 42181.08 39935.61 41961.84 36419.94 17393.91 28361.13 4280487 4693.65 12493.2 18593.64 19591.53 20016.96 4578.81 35525.58 12898.62 32564.1 38229.54 328686 6943.47 11080.32 18524.91 14555.1 32307,45 37256.88 4211061 Research 48484 45903 48232 41862 19993 32599 49201 5395 14360 21372 22519 23008 5263 40834 14826 37430 43942 37780 7981 12736 21293 16730 37135 42824 48403 There is raw dummy data on the next tab called "Data for Excel" This includes: Please use the data to show: A pivot table of the Operating expense category (rows) total by person (cols), formatted with a grand total column listing the largest to smallest total spend by type of cost. Please ensure formatting for executive consumption. b) It came to the attention of the Finance team that the website might have incorrectly applied a 5% tax rate to some of the transactions in the data. Please find the transactions and sort these from the others in a pivot table, showing the total of each kind


