Answered step by step
Verified Expert Solution
Question
1 Approved Answer
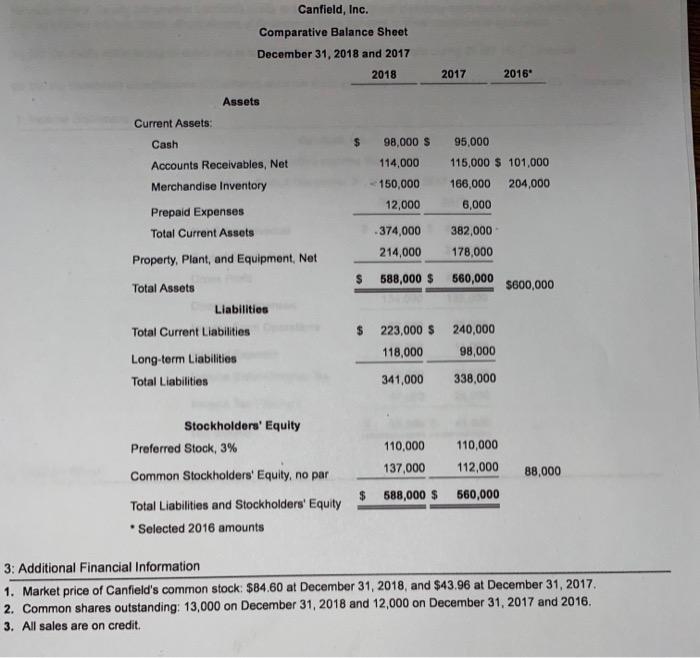
Canfield, Inc. Comparative Balance Sheet December 31, 2018 and 2017 2018 Assets Current Assets: Cash Accounts Receivables, Net Merchandise Inventory Total Assets Prepaid Expenses


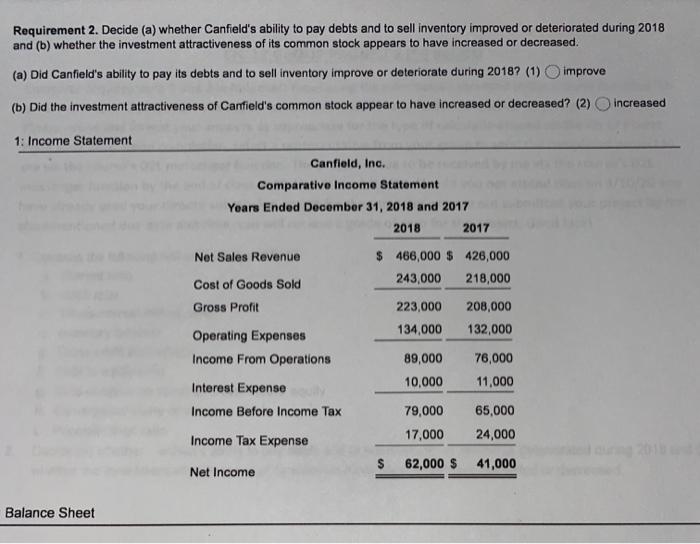
Canfield, Inc. Comparative Balance Sheet December 31, 2018 and 2017 2018 Assets Current Assets: Cash Accounts Receivables, Net Merchandise Inventory Total Assets Prepaid Expenses Total Current Assets Property, Plant, and Equipment, Net Liabilities Total Current Liabilities. Long-term Liabilities Total Liabilities Stockholders' Equity Preferred Stock, 3% Common Stockholders' Equity, no par Total Liabilities and Stockholders' Equity * Selected 2016 amounts $ $ 98,000 $ $ 95,000 114,000 115,000 $ 101,000 150,000 166,000 204,000 12,000 6,000 -374,000 214,000 588,000 $ $ 223,000 $ 118,000 341,000 2017 382,000 178,000 560,000 240,000 98,000 338,000 2016* 110,000 110,000 137,000 112,000 588,000 $ 560,000 $600,000 88,000 3: Additional Financial Information 1. Market price of Canfield's common stock: $84.60 at December 31, 2018, and $43.96 at December 31, 2017. 2. Common shares outstanding: 13,000 on December 31, 2018 and 12,000 on December 31, 2017 and 2016. 3. All sales are on credit. Requirement 2. Decide (a) whether Canfield's ability to pay debts and to sell inventory improved or deteriorated during 2018 and (b) whether the investment attractiveness of its common stock appears to have increased or decreased. (a) Did Canfield's ability to pay its debts and to sell inventory improve or deteriorate during 2018? (1) improve (b) Did the investment attractiveness of Canfield's common stock appear to have increased or decreased? (2) 1: Income Statement Balance Sheet Canfield, Inc.. Comparative Income Statement Years Ended December 31, 2018 and 2017 2018 Net Sales Revenue Cost of Goods Sold Gross Profit Operating Expenses Income From Operations Interest Expense Income Before Income Tax Income Tax Expense Net Income $ 466,000 $426,000 243,000 218,000 2017 223,000 208,000 134,000 132,000 89,000 10,000 79,000 17,000 62,000 $ 76,000 11,000 65,000 24,000 41,000 increased Earnings per share Profit (after income tax) - Preference dividends Weighted average number of ordinary shares issued
Step by Step Solution
★★★★★
3.38 Rating (157 Votes )
There are 3 Steps involved in it
Step: 1
a Ability to Pay Debts and Sell Inventory Changes in Current Assets Change in Cash 98000 2018 950...
Get Instant Access to Expert-Tailored Solutions
See step-by-step solutions with expert insights and AI powered tools for academic success
Step: 2

Step: 3

Ace Your Homework with AI
Get the answers you need in no time with our AI-driven, step-by-step assistance
Get Started


