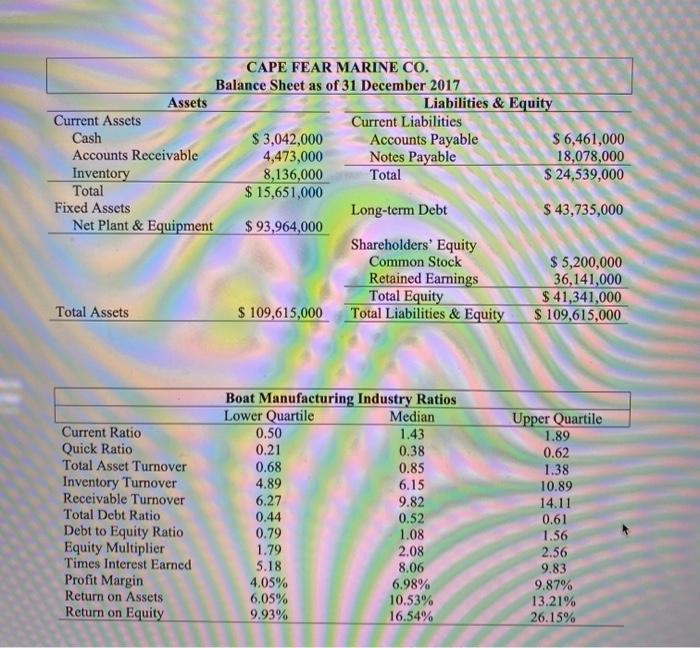
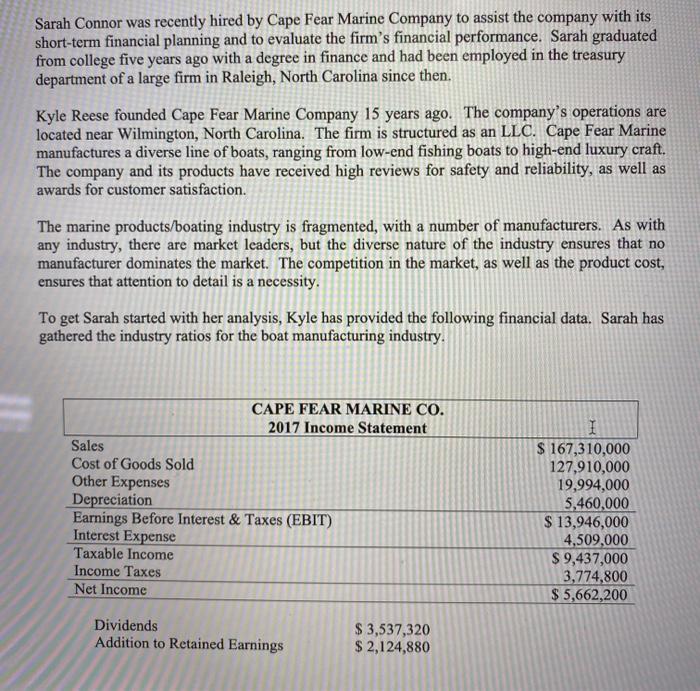
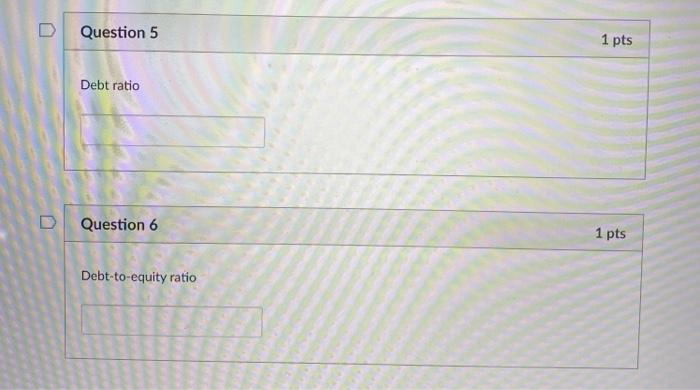
CAPE FEAR MARINE CO. Balance Sheet as of 31 December 2017 Assets Liabilities & Equity Current Assets Current Liabilities Cash $ 3,042,000 Accounts Payable $ 6,461,000 Accounts Receivable 4,473,000 Notes Payable 18,078,000 Inventory 8,136,000 Total $ 24,539,000 Total $ 15,651,000 Fixed Assets Long-term Debt $ 43,735,000 Net Plant & Equipment $ 93,964,000 Shareholders' Equity Common Stock $ 5,200,000 Retained Earnings 36,141,000 Total Equity $ 41,341,000 Total Assets $ 109,615,000 Total Liabilities & Equity $ 109,615,000 Current Ratio Quick Ratio Total Asset Turnover Inventory Turnover Receivable Turnover Total Debt Ratio Debt to Equity Ratio Equity Multiplier Times Interest Earned Profit Margin Return on Assets Return on Equity Boat Manufacturing Industry Ratios Lower Quartile Median 0.50 1.43 0.21 0.38 0.68 0.85 4.89 6.15 6.27 9.82 0.44 0.52 0.79 1.08 1.79 2.08 5.18 8.06 4.05% 6.98% 6.05% 10.53% 9.93% 16.54% Upper Quartile 1.89 0.62 1.38 10.89 14.11 0.61 1.56 2.56 9.83 9.87% 13.21% 26.15% Sarah Connor was recently hired by Cape Fear Marine Company to assist the company with its short-term financial planning and to evaluate the firm's financial performance. Sarah graduated from college five years ago with a degree in finance and had been employed in the treasury department of a large firm in Raleigh, North Carolina since then. Kyle Reese founded Cape Fear Marine Company 15 years ago. The company's operations are located near Wilmington, North Carolina. The firm is structured as an LLC. Cape Fear Marine manufactures a diverse line of boats, ranging from low-end fishing boats to high-end luxury craft. The company and its products have received high reviews for safety and reliability, as well as awards for customer satisfaction. The marine products/boating industry is fragmented, with a number of manufacturers. As with any industry, there are market leaders, but the diverse nature of the industry ensures that no manufacturer dominates the market. The competition in the market, as well as the product cost, ensures that attention to detail is a necessity. To get Sarah started with her analysis, Kyle has provided the following financial data. Sarah has gathered the industry ratios for the boat manufacturing industry. CAPE FEAR MARINE CO. 2017 Income Statement Sales Cost of Goods Sold Other Expenses Depreciation Earnings Before Interest & Taxes (EBIT) Interest Expense Taxable Income Income Taxes Net Income I $ 167,310,000 127,910,000 19,994,000 5,460,000 $ 13,946,000 4,509,000 $ 9,437,000 3,774,800 $ 5,662,200 Dividends Addition to Retained Earnings $ 3,537,320 $ 2,124,880 Question 5 1 pts Debt ratio Question 6 1 pts Debt-to-equity ratio


