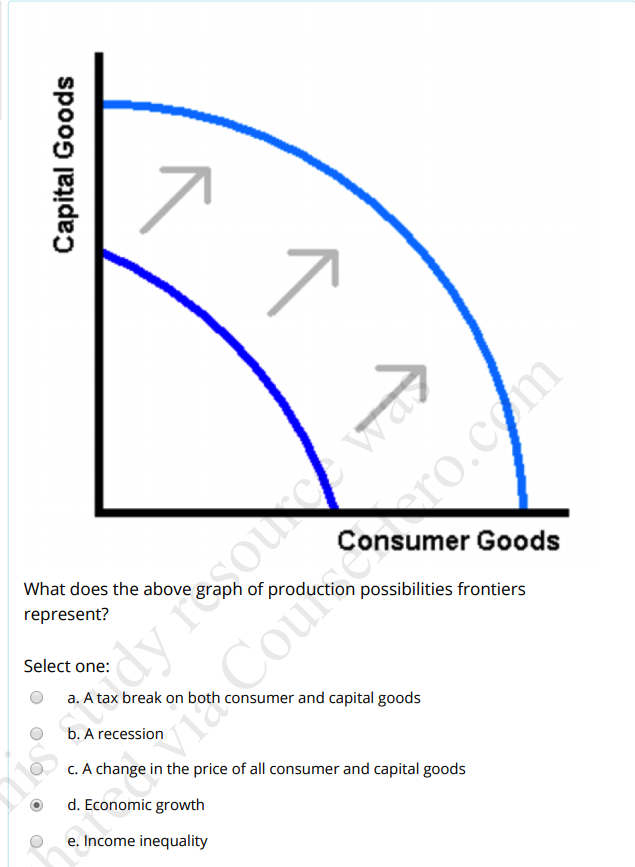
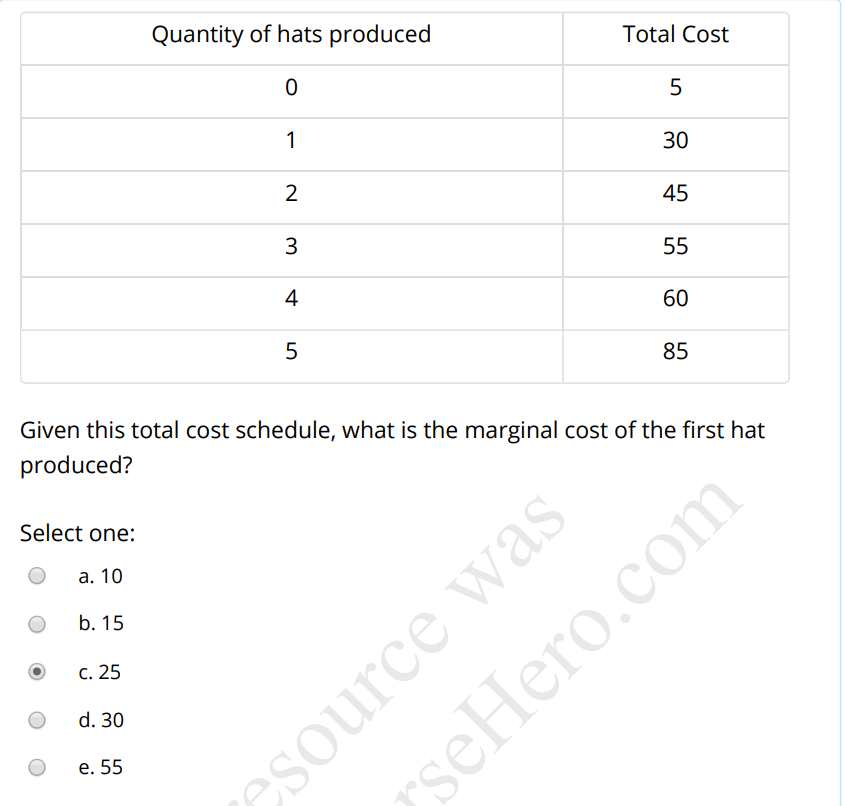
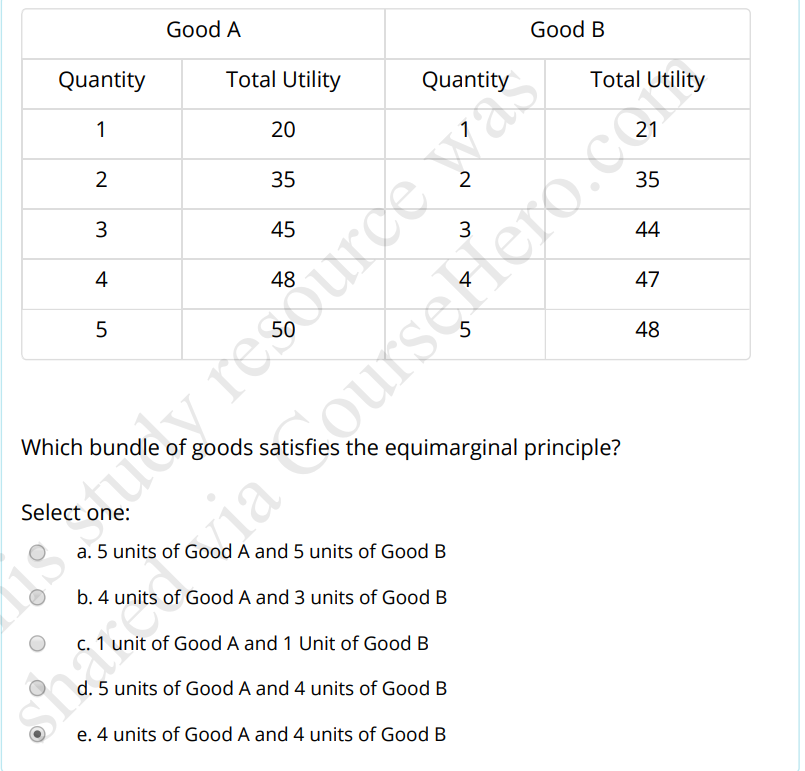
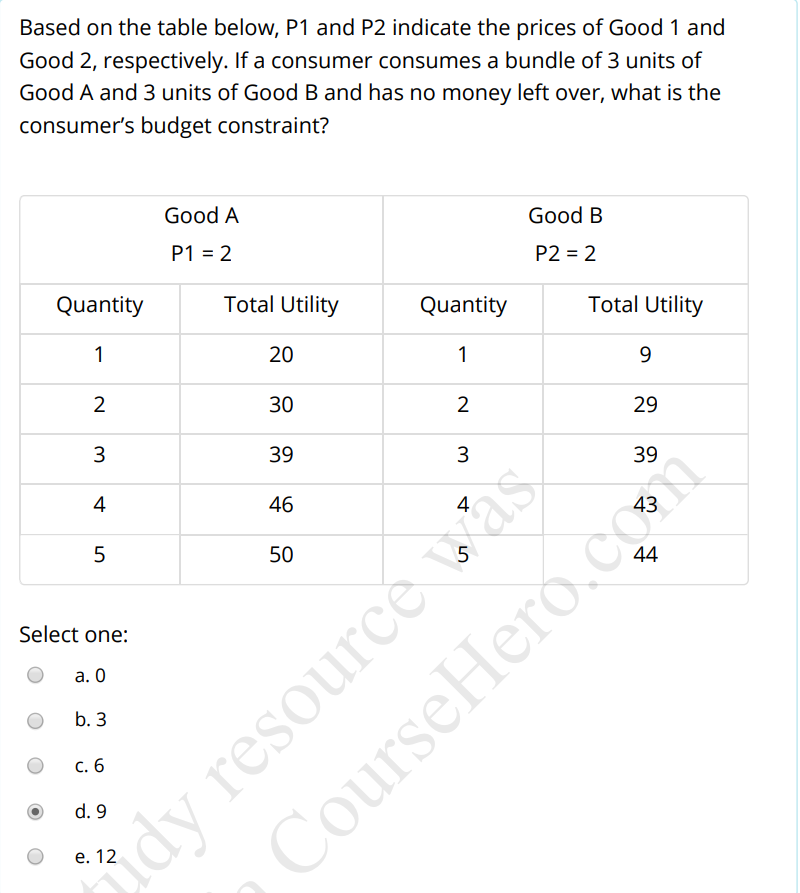
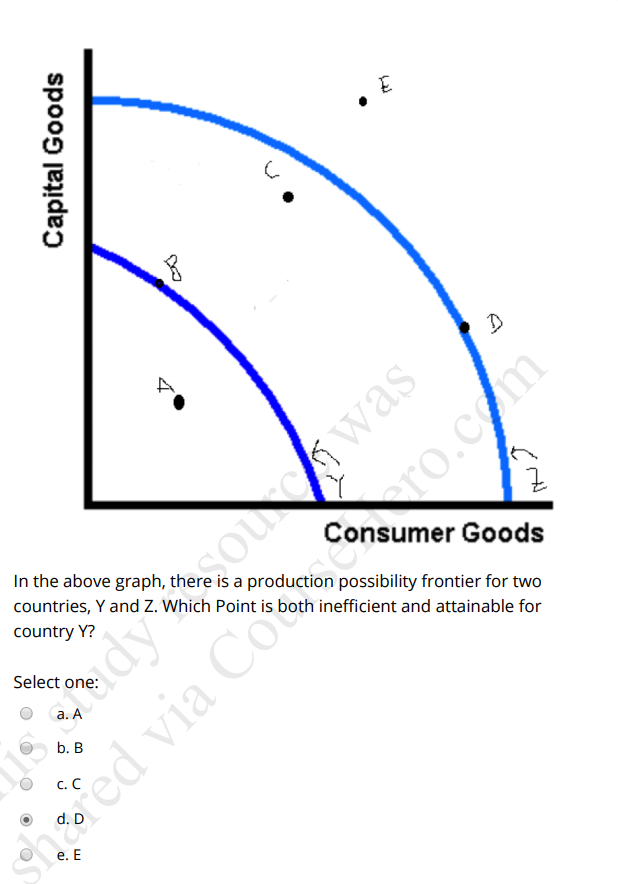
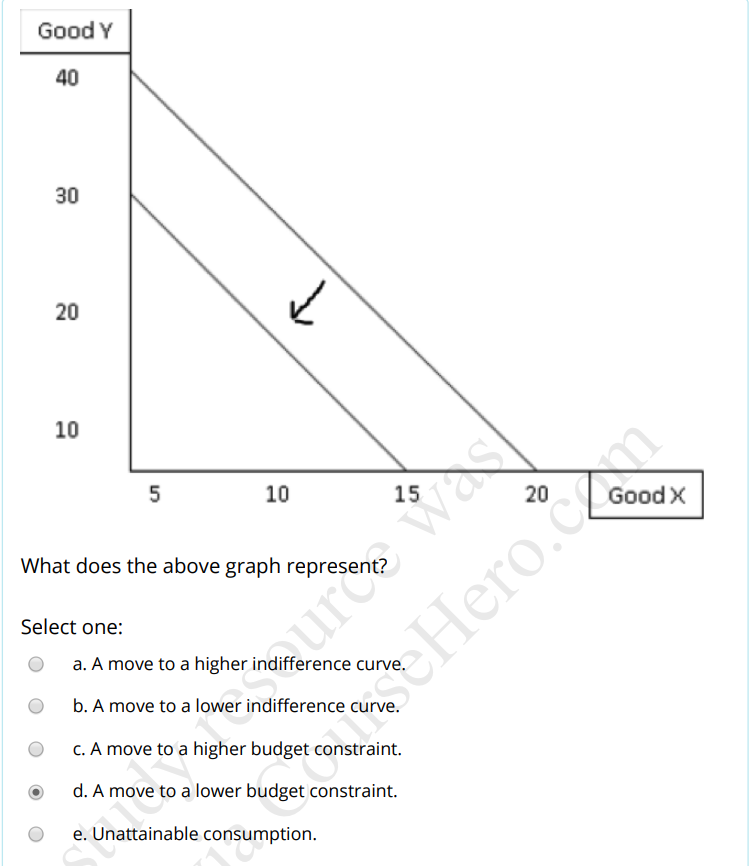
Capital Goods Consumer Goods What does the above graph of production possibilities frontiers represent? Select one: 0 a. A tax break on both consumer and capital goods b. A recession c. A change in the price of all consumer and capital goods d. Economic growth 06300 e. Income inequality Quantity of hats produced Total Cost 0 5 1 30 2 45 3 55 4 60 5 85 Given this total cost schedule, what is the marginal cost of the first hat produced? Select one: Q a. 10 O b. 15 G) c. 25 Q d. 30 O e. 55 Good A Good B Quantity Total Utility Quantity Total Utility - 20 1 21 2 35 2 35 W 45 3 44 4 48 4 47 5 reso 5 48 ou Which bundle of goods satisfies the equimarginal principle? Select one: a. 5 units of Good A and 5 units of Good B b. 4 units of Good A and 3 units of Good B O c. 1 unit of Good A and 1 Unit of Good B d. 5 units of Good A and 4 units of Good B e. 4 units of Good A and 4 units of Good BBased on the table below, P1 and P2 indicate the prices of Good 1 and Good 2, respectively. If a consumer consumes a bundle of 3 units of Good A and 3 units of Good B and has no money left over. what is the consumer's budget constraint? Good A Good B P1 = 2 P2 = 2 Quantity Total Utility Quantity Total Utility 1 20 'l 9 2 30 2 29 3 39 3 39 4 46 4 43 5 50 5 44 Select one: Q a. D O b. 3 O c. 6 @ d. 9 G e. 12 Capital Goods . E was m ro.c O Consumer Goods In the above graph, there is a production possibility frontier for two countries, Y and Z. Which Point is both inefficient and attainable for country Y? Select one: dy O a. A ed via Co b. B C. C O d. D e. EGood Y 40 30 20 10 5 10 15 Ja 20 Good X What does the above graph represent? Hero.C Select one: O a. A move to a higher indifference curve. O b. A move to a lower indifference curve. O c. A move to a higher budget constraint. O d. A move to a lower budget constraint. O e. Unattainable consumption