

Answered step by step
Verified Expert Solution
Question
1 Approved Answer
capter 10. 24 i need help with number 24 385 17. Download the spreadshort from MyFinanceLab containing the data for Figur 10.1. a. Compuse the
capter 10. 24
385 17. Download the spreadshort from MyFinanceLab containing the data for Figur 10.1. a. Compuse the average return for each of the assens from 1929 to 1940 (The Great Depression). b. Compute the variance and standard deviation for each of the anses from 1929 to 1940. c. Which asset was riskiest during the Great Depression? How does that fe with your intuition 18. Using the data from Problem 17, repeat your analysis over the 1990 a. Which auet was riskiest? b. Compare the standard deviations of the assess in the 1990s to their standard deviations in the Great Depression. Which had the greates difference between the two periode c. If you only had information about the 1990s, what would you conclude about the relative risk of investing in small stocks? 19. What if the last two and a half decades had been "normal"? Download the specalsbert from MyFinanceLab containing the data for Figure 10.1. a. Calculate the arithmetic average return on the S&P 500 from 1926 to 1989. b. Assuming that the S&P 500 had simply concised to carn the average return from a calculate the amount that $100 invested at the end of 1925 would have grown to by the end of 2014. c. Do the same for small stocks Common Versus Independent Risk 20. Consider two local banks. Bank A has 76 loans outstanding, cach for $1 million, that it expects will be repaid today. Each loan has a 6% probability of default, in which case the bank is not repaid anything. The chance of default is independent across all the loans. Bank B has only one loan of $76 million outstanding, which it also expects will be repaid today. It also has a 6% probability of not being repaid. Explain the difference between the type of risk each bank faces Which bank faces less risk? Why? 21. Using the data in Problem 20, calculate a. The expected overall payoff of each bank b. The standard deviation of the overall payoff of each bank Diversification in Stock Portfolios 22. Consider the following two, completely separate, economies. The expected return and volatility of all stocks in both economies is the same. In the first economy, all stocks move together-in good times all prices rise together and in bad times they all fall together. In the second economy. stock returns are independent one stock increasing in price has no effect on the prices of other stocks. Assuming you are risk-avere and you could choose one of the two economies in which to invest, which one would you choose? Explain. 23. Consider an economy with two types of firms, S and L. S firms all move together. I firms move independently. For both types of firms, there is a 70% probability that the firms will have a 7% return and a 30% probability that the firms will have a -18% return. What is the volatility (standard deviation) of a portfolio that consists of an equal investment in 35 firms of (a) type s and (b) type 1? *24. Using the data in Problem 23, plot the volatility as a function of the number of firms in the wo portfolios. 25. Explain why the risk premium of a stock does not depend on its diversifiable risk 26. Identify each of the following risks as most likely to be systematic risk of diversifiable risk a. The risk that your main production plant is shut down due to a tornado b. The risk that the economy slows, decreasing demand for your firm's products. c. The risk that your best employees will be hired away. d. The risk that the new product you expect your R&D division to prodace will oor materialize 385 17. Download the spreadshort from MyFinanceLab containing the data for Figur 10.1. a. Compuse the average return for each of the assens from 1929 to 1940 (The Great Depression). b. Compute the variance and standard deviation for each of the anses from 1929 to 1940. c. Which asset was riskiest during the Great Depression? How does that fe with your intuition 18. Using the data from Problem 17, repeat your analysis over the 1990 a. Which auet was riskiest? b. Compare the standard deviations of the assess in the 1990s to their standard deviations in the Great Depression. Which had the greates difference between the two periode c. If you only had information about the 1990s, what would you conclude about the relative risk of investing in small stocks? 19. What if the last two and a half decades had been "normal"? Download the specalsbert from MyFinanceLab containing the data for Figure 10.1. a. Calculate the arithmetic average return on the S&P 500 from 1926 to 1989. b. Assuming that the S&P 500 had simply concised to carn the average return from a calculate the amount that $100 invested at the end of 1925 would have grown to by the end of 2014. c. Do the same for small stocks Common Versus Independent Risk 20. Consider two local banks. Bank A has 76 loans outstanding, cach for $1 million, that it expects will be repaid today. Each loan has a 6% probability of default, in which case the bank is not repaid anything. The chance of default is independent across all the loans. Bank B has only one loan of $76 million outstanding, which it also expects will be repaid today. It also has a 6% probability of not being repaid. Explain the difference between the type of risk each bank faces Which bank faces less risk? Why? 21. Using the data in Problem 20, calculate a. The expected overall payoff of each bank b. The standard deviation of the overall payoff of each bank Diversification in Stock Portfolios 22. Consider the following two, completely separate, economies. The expected return and volatility of all stocks in both economies is the same. In the first economy, all stocks move together-in good times all prices rise together and in bad times they all fall together. In the second economy. stock returns are independent one stock increasing in price has no effect on the prices of other stocks. Assuming you are risk-avere and you could choose one of the two economies in which to invest, which one would you choose? Explain. 23. Consider an economy with two types of firms, S and L. S firms all move together. I firms move independently. For both types of firms, there is a 70% probability that the firms will have a 7% return and a 30% probability that the firms will have a -18% return. What is the volatility (standard deviation) of a portfolio that consists of an equal investment in 35 firms of (a) type s and (b) type 1? *24. Using the data in Problem 23, plot the volatility as a function of the number of firms in the wo portfolios. 25. Explain why the risk premium of a stock does not depend on its diversifiable risk 26. Identify each of the following risks as most likely to be systematic risk of diversifiable risk a. The risk that your main production plant is shut down due to a tornado b. The risk that the economy slows, decreasing demand for your firm's products. c. The risk that your best employees will be hired away. d. The risk that the new product you expect your R&D division to prodace will oor materialize i need help with number 24 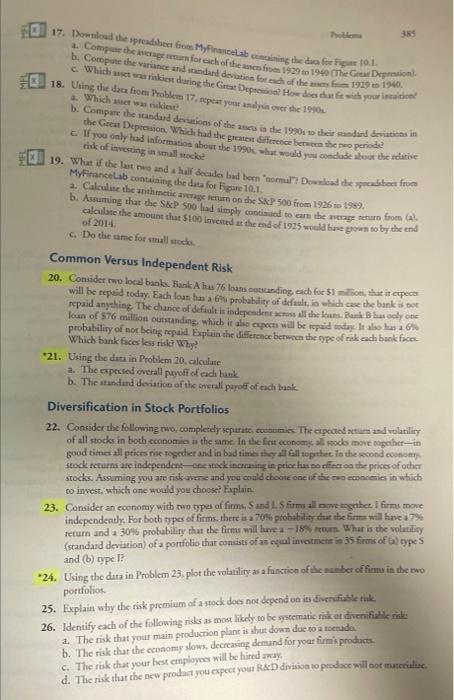
Step by Step Solution
There are 3 Steps involved in it
Step: 1

Get Instant Access to Expert-Tailored Solutions
See step-by-step solutions with expert insights and AI powered tools for academic success
Step: 2

Step: 3
Ace Your Homework with AI
Get the answers you need in no time with our AI-driven, step-by-step assistance
Get Started
Order Flow Trading Secrets To Mastering Market Sentiment Liquidity Volume Patterns Price Action Trading Tools And More
Authors: Daren Price
1st Edition
979-8864803738