

Answered step by step
Verified Expert Solution
Question
1 Approved Answer
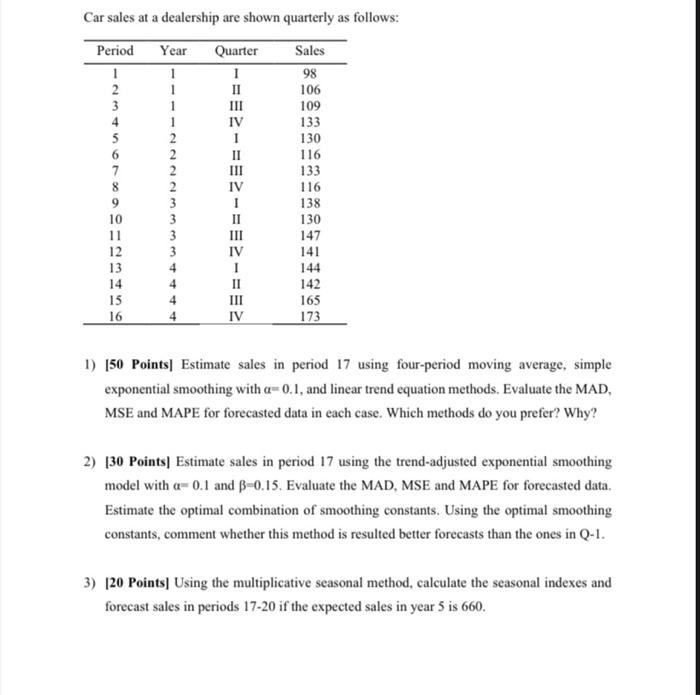
Car sales at a dealership are shown quarterly as follows: Period Year Quarter Sales 1 1 98 2 1 II 106 3 1 109 4
Step by Step Solution
There are 3 Steps involved in it
Step: 1

Get Instant Access to Expert-Tailored Solutions
See step-by-step solutions with expert insights and AI powered tools for academic success
Step: 2

Step: 3
Ace Your Homework with AI
Get the answers you need in no time with our AI-driven, step-by-step assistance
Get Started
Smart Supply Chain Finance
Authors: Hua Song
1st Edition
9811659966, 978-9811659966