

Answered step by step
Verified Expert Solution
Question
1 Approved Answer
Caroline has a $10 dessert budget that she uses to buy pie and cake. Assume the price of pie (Pp) is fixed at $2.
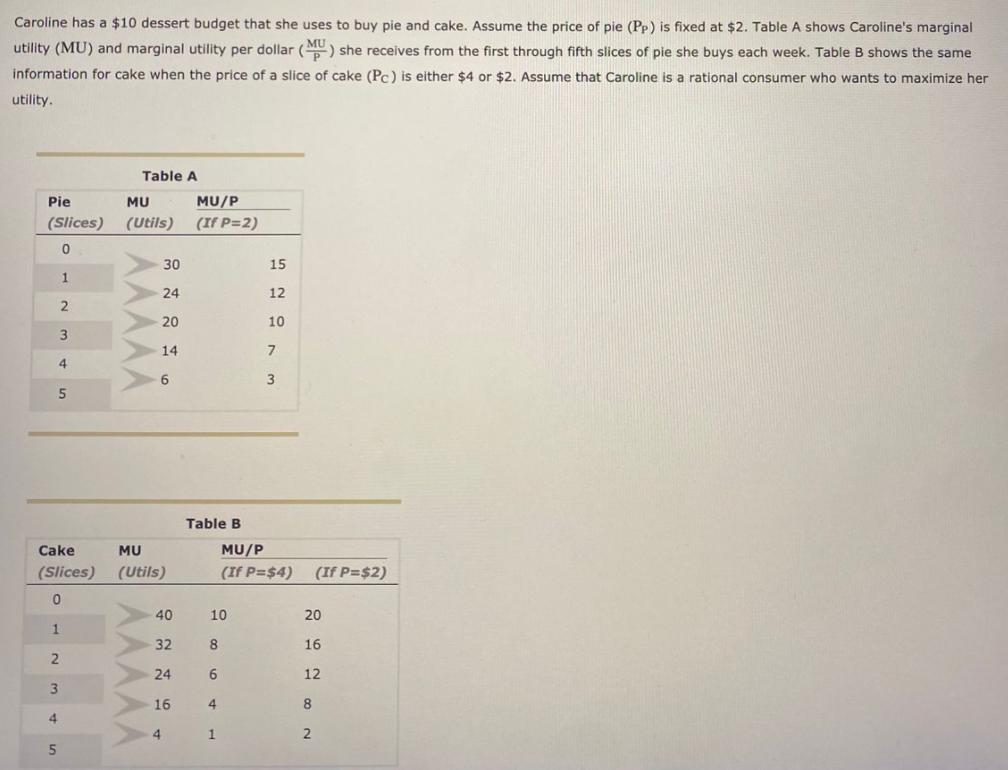
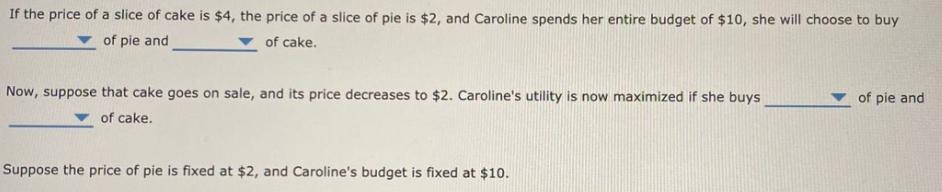
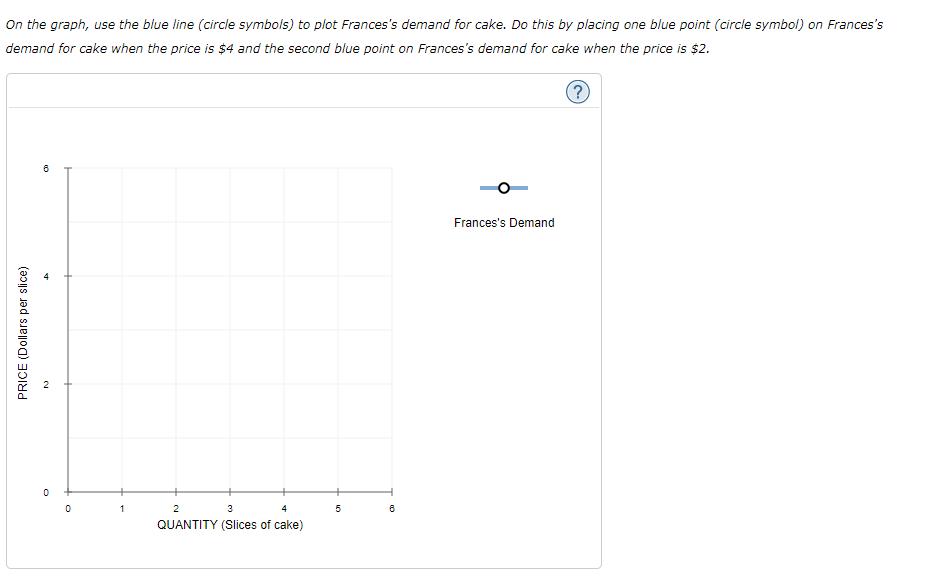
Caroline has a $10 dessert budget that she uses to buy pie and cake. Assume the price of pie (Pp) is fixed at $2. Table A shows Caroline's marginal utility (MU) and marginal utility per dollar () she receives from the first through fifth slices of pie she buys each week. Table B shows the same information for cake when the price of a slice of cake (Pc) is either $4 or $2. Assume that Caroline is a rational consumer who wants to maximize her utility. Table A Pie MU MU/P (Slices) (Utils) (If P=2) 30 15 1. 24 12 20 10 14 7 4. 6 5 Table B Cake MU MU/P (Slices) (Utils) (If P=$4) (If P=$2) 40 10 20 32 8 16 24 12 16 4. 4 4. 1 2 5 AAAAA AAAAA If the price of a slice of cake is $4, the price of a slice of pie is $2, and Caroline spends her entire budget of $10, she will choose to buy of pie and of cake. Now, suppose that cake goes on sale, and its price decreases to $2. Caroline's utility is now maximized if she buys of pie and of cake. Suppose the price of pie is fixed at $2, and Caroline's budget is fixed at $10. On the graph, use the blue line (circle symbols) to plot Frances's demand for cake. Do this by placing one blue point (circle symbol) on Frances's demand for cake when the price is $4 and the second blue point on Frances's demand for cake when the price is $2. Frances's Demand 1 2 3 4 5 QUANTITY (Slices of cake) PRICE (Dollars per slice) Caroline has a $10 dessert budget that she uses to buy pie and cake. Assume the price of pie (Pp) is fixed at $2. Table A shows Caroline's marginal utility (MU) and marginal utility per dollar () she receives from the first through fifth slices of pie she buys each week. Table B shows the same information for cake when the price of a slice of cake (Pc) is either $4 or $2. Assume that Caroline is a rational consumer who wants to maximize her utility. Table A Pie MU MU/P (Slices) (Utils) (If P=2) 30 15 1. 24 12 20 10 14 7 4. 6 5 Table B Cake MU MU/P (Slices) (Utils) (If P=$4) (If P=$2) 40 10 20 32 8 16 24 12 16 4. 4 4. 1 2 5 AAAAA AAAAA If the price of a slice of cake is $4, the price of a slice of pie is $2, and Caroline spends her entire budget of $10, she will choose to buy of pie and of cake. Now, suppose that cake goes on sale, and its price decreases to $2. Caroline's utility is now maximized if she buys of pie and of cake. Suppose the price of pie is fixed at $2, and Caroline's budget is fixed at $10. On the graph, use the blue line (circle symbols) to plot Frances's demand for cake. Do this by placing one blue point (circle symbol) on Frances's demand for cake when the price is $4 and the second blue point on Frances's demand for cake when the price is $2. Frances's Demand 1 2 3 4 5 QUANTITY (Slices of cake) PRICE (Dollars per slice) Caroline has a $10 dessert budget that she uses to buy pie and cake. Assume the price of pie (Pp) is fixed at $2. Table A shows Caroline's marginal utility (MU) and marginal utility per dollar () she receives from the first through fifth slices of pie she buys each week. Table B shows the same information for cake when the price of a slice of cake (Pc) is either $4 or $2. Assume that Caroline is a rational consumer who wants to maximize her utility. Table A Pie MU MU/P (Slices) (Utils) (If P=2) 30 15 1. 24 12 20 10 14 7 4. 6 5 Table B Cake MU MU/P (Slices) (Utils) (If P=$4) (If P=$2) 40 10 20 32 8 16 24 12 16 4. 4 4. 1 2 5 AAAAA AAAAA If the price of a slice of cake is $4, the price of a slice of pie is $2, and Caroline spends her entire budget of $10, she will choose to buy of pie and of cake. Now, suppose that cake goes on sale, and its price decreases to $2. Caroline's utility is now maximized if she buys of pie and of cake. Suppose the price of pie is fixed at $2, and Caroline's budget is fixed at $10. On the graph, use the blue line (circle symbols) to plot Frances's demand for cake. Do this by placing one blue point (circle symbol) on Frances's demand for cake when the price is $4 and the second blue point on Frances's demand for cake when the price is $2. Frances's Demand 1 2 3 4 5 QUANTITY (Slices of cake) PRICE (Dollars per slice) Caroline has a $10 dessert budget that she uses to buy pie and cake. Assume the price of pie (Pp) is fixed at $2. Table A shows Caroline's marginal utility (MU) and marginal utility per dollar () she receives from the first through fifth slices of pie she buys each week. Table B shows the same information for cake when the price of a slice of cake (Pc) is either $4 or $2. Assume that Caroline is a rational consumer who wants to maximize her utility. Table A Pie MU MU/P (Slices) (Utils) (If P=2) 30 15 1. 24 12 20 10 14 7 4. 6 5 Table B Cake MU MU/P (Slices) (Utils) (If P=$4) (If P=$2) 40 10 20 32 8 16 24 12 16 4. 4 4. 1 2 5 AAAAA AAAAA If the price of a slice of cake is $4, the price of a slice of pie is $2, and Caroline spends her entire budget of $10, she will choose to buy of pie and of cake. Now, suppose that cake goes on sale, and its price decreases to $2. Caroline's utility is now maximized if she buys of pie and of cake. Suppose the price of pie is fixed at $2, and Caroline's budget is fixed at $10. On the graph, use the blue line (circle symbols) to plot Frances's demand for cake. Do this by placing one blue point (circle symbol) on Frances's demand for cake when the price is $4 and the second blue point on Frances's demand for cake when the price is $2. Frances's Demand 1 2 3 4 5 QUANTITY (Slices of cake) PRICE (Dollars per slice)
Step by Step Solution
★★★★★
3.36 Rating (162 Votes )
There are 3 Steps involved in it
Step: 1
A utility maximizing consumer consumes in decreasing order of marginal utility of dollars The utilit...
Get Instant Access to Expert-Tailored Solutions
See step-by-step solutions with expert insights and AI powered tools for academic success
Step: 2

Step: 3
Document Format ( 2 attachments)
635e2e2644b44_182134.pdf
180 KBs PDF File
635e2e2644b44_182134.docx
120 KBs Word File
Ace Your Homework with AI
Get the answers you need in no time with our AI-driven, step-by-step assistance
Get Started
Elementary Principles of Chemical Processes
Authors: Richard M. Felder, Ronald W. Rousseau
3rd Edition
978-0471687573, 9788126515820, 978-0-471-4152, 0471720631, 047168757X, 8126515821, 978-0471720638