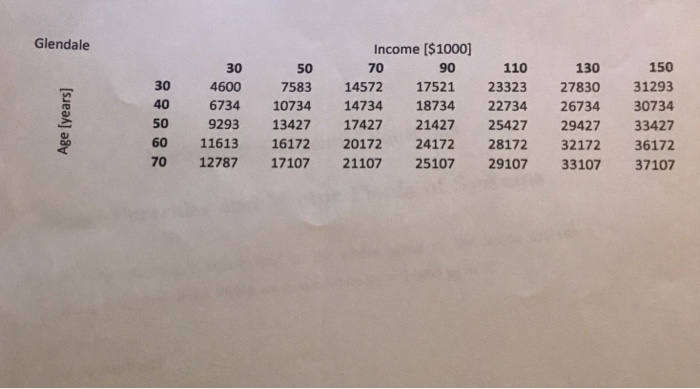
CarValue_3d_matrix.xlsx (an Excel spreadsheet that contains the data for this assignment) CarValues_3d_matrix_examples.m (a MATLAB script that that will serve as an example to help you complete the assignment) Create a new script that contains the following sections (i.e. use %%), with the content as described: 1. Define values 2. Import data 3. Organize data a. For sections 1-3, follow the example script for format, etc. 4. Individual data Use fprintf to write a sentence stating the car value for a 70-year old who lives in Scottsdale and makes $90,000 per year Use fprintf to write a sentence stating the car value for a 40-year old who lives in Phoenix and makes $110,000 per year a. b. 5. Statistical calculations Compute the following and store each into a well-named variable (i.e. easy to identify what it is used for): a. i. ii. Average car value of all Glendalites Standard deviation of the car values of all Glendalites 1. Important note: When computing the standard deviation, you cannot do it correctly with a statement like: std G std(std(cv_G)) (i.e. taking the standard deviation of a standard deviation) a. Instead, you should first convert the matrix into a vector, such as: i. std G-std(cv_G); ii. Average car value of all Scottsdalians who make $70,000 per year iv. Standard deviations of all car values of all Scottsdalians who make $70,000 v. The largest car value found in the entire data set 6. A contour plot of Car Value vs. Age and Income a. Make a set of three subplot contour plots (similar to the example script) b. Include a colorbar 7. A line plot of Car Value vs. Income a. Include one line for each city b. Use the average across all ages within each income level c. Use a legend and axes labels Submission requirements: Publish your script to a pdf from within MATLAB and upload to Canvas CarValue_3d_matrix.xlsx (an Excel spreadsheet that contains the data for this assignment) CarValues_3d_matrix_examples.m (a MATLAB script that that will serve as an example to help you complete the assignment) Create a new script that contains the following sections (i.e. use %%), with the content as described: 1. Define values 2. Import data 3. Organize data a. For sections 1-3, follow the example script for format, etc. 4. Individual data Use fprintf to write a sentence stating the car value for a 70-year old who lives in Scottsdale and makes $90,000 per year Use fprintf to write a sentence stating the car value for a 40-year old who lives in Phoenix and makes $110,000 per year a. b. 5. Statistical calculations Compute the following and store each into a well-named variable (i.e. easy to identify what it is used for): a. i. ii. Average car value of all Glendalites Standard deviation of the car values of all Glendalites 1. Important note: When computing the standard deviation, you cannot do it correctly with a statement like: std G std(std(cv_G)) (i.e. taking the standard deviation of a standard deviation) a. Instead, you should first convert the matrix into a vector, such as: i. std G-std(cv_G); ii. Average car value of all Scottsdalians who make $70,000 per year iv. Standard deviations of all car values of all Scottsdalians who make $70,000 v. The largest car value found in the entire data set 6. A contour plot of Car Value vs. Age and Income a. Make a set of three subplot contour plots (similar to the example script) b. Include a colorbar 7. A line plot of Car Value vs. Income a. Include one line for each city b. Use the average across all ages within each income level c. Use a legend and axes labels Submission requirements: Publish your script to a pdf from within MATLAB and upload to Canvas