Case 1 - ADME Pipe Ltd. ADME Pipe Lid. manufactures various industrial pipe flanges. Blind Flanges used to block off pipelines and stop fluids from
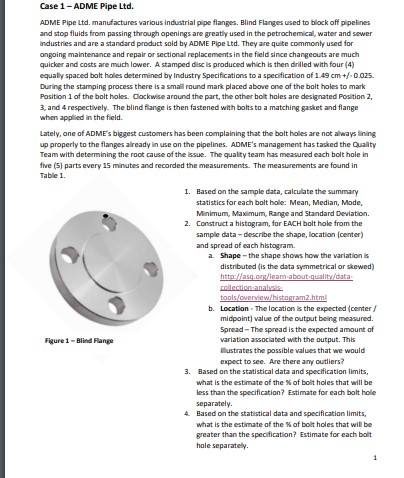
Case 1 - ADME Pipe Ltd. ADME Pipe Lid. manufactures various industrial pipe flanges. Blind Flanges used to block off pipelines and stop fluids from passing through openings are greatly used in the petrochemical, water and sewer industries and are a standard product sold by ADME Pipe Led. They are quite commonly used for ongoing maintenance and repair or sectional replacements in the field since changeouts are much quicker and costs are much lower. A stamped disc is produced which is then drilled with four (4) equally spaced bolt holes determined by Industry Specifications to a specification of 1 49 cm +/- 0.025. During the stamping process there is a small round mark placed above one of the bolt holes to mark Position 1 of the bolt holes. Clockwise around the part, the other bolt holes are designated Position ?, 3, and 4 respectively. The blind flange is then fastened with bolts to a matching gasket and flange when applied in the field. Lately, one of ADME's biggest customers has been complaining that the bolt holes are not always lining up properly to the flanges already in use on the pipelines. ADME's management has tacked the Quality Team with determining the root cause of the Issue. The quality team has measured each bolt hole in five (5] parts every 15 minutes and recorded the measurements. The measurements are found in Table 1. 1. Based on the sample data, calculate the summary statistics for each bolt hole: Mean, Median, Mode, Minimum, Maximum, Range and Standard Deviation. 2. Construct a histogram, for EACH bolt hole from the sample data - describe the shape, location (center) and spread of each histogram. a. Shape - the shape shows how the variation is distributed (is the data symmetrical or skewed) http://asq.org/learn about quality/data. collection anababs tools /overview/histogram2.html b. Location . The location is the expected (center / midpoint] value of the output being measured. Spread - The spread is the expected amount of Figure 1 - Blind Flange variation associated with the output. This Bustrates the possible values that we would expect to see. Are there any outliers? 3. Based on the statistical data and specification limits, what is the estimate of the % of bolt holes that will be less than the specification? Estimate for each bolt hole separately. Based on the statistical data and specification limits, what is the estimate of the % of bolt holes that will be greater than the specification? Estimate for each bolt hole separately
Step by Step Solution
There are 3 Steps involved in it
Step: 1
Get Instant Access to Expert-Tailored Solutions
See step-by-step solutions with expert insights and AI powered tools for academic success
Step: 2
Step: 3
Ace Your Homework with AI
Get the answers you need in no time with our AI-driven, step-by-step assistance