

Answered step by step
Verified Expert Solution
Question
1 Approved Answer
CASE 1: Call Center You are asked to measure the cost effectiveness of an employee group at a large call center. You have detailed information
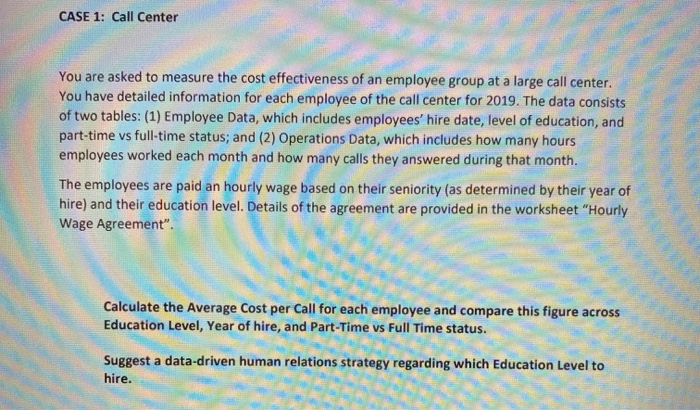
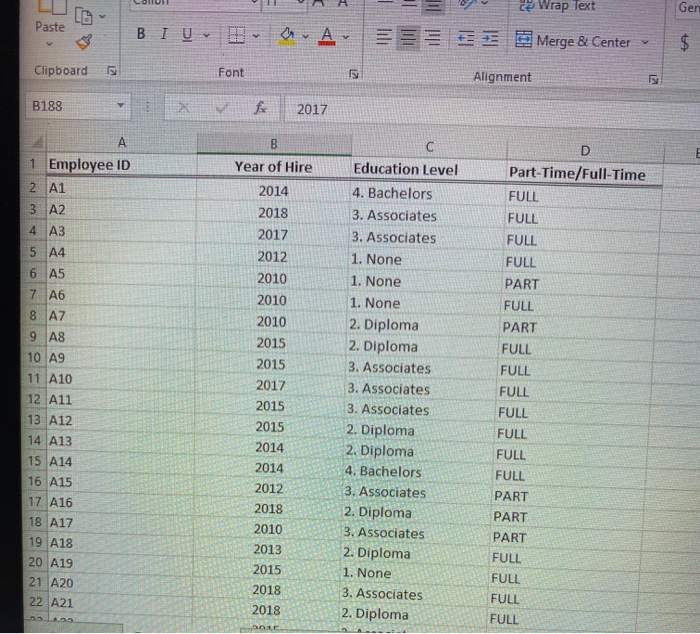

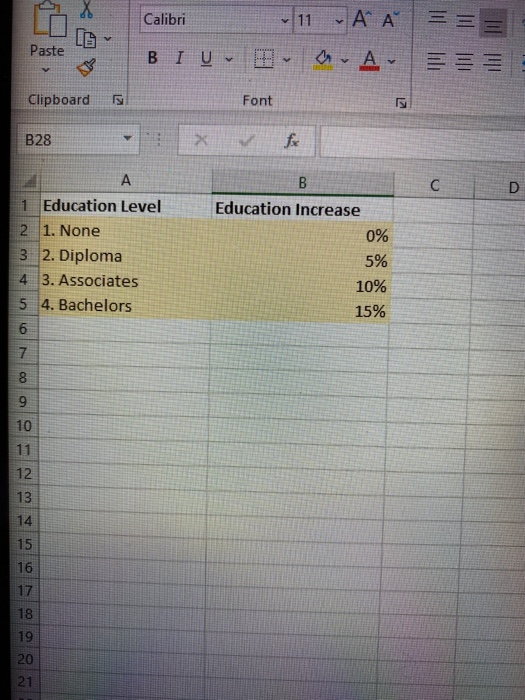
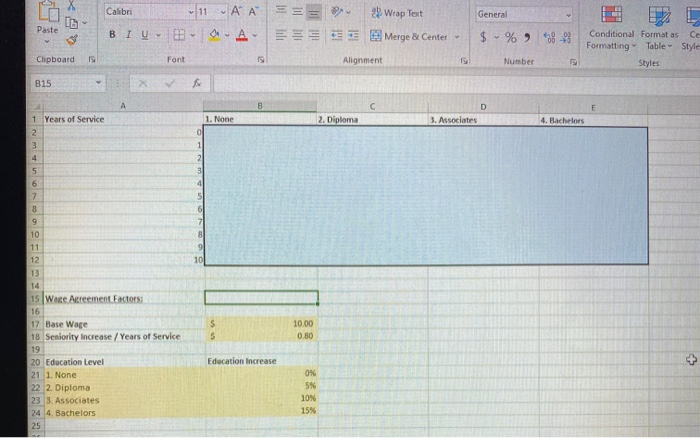 CASE 1: Call Center You are asked to measure the cost effectiveness of an employee group at a large call center. You have detailed information for each employee of the call center for 2019. The data consists of two tables: (1) Employee Data, which includes employees' hire date, level of education, and part-time vs full-time status; and (2) Operations Data, which includes how many hours employees worked each month and how many calls they answered during that month. The employees are paid an hourly wage based on their seniority (as determined by their year of hire) and their education level. Details of the agreement are provided in the worksheet "Hourly Wage Agreement". Calculate the Average Cost per Call for each employee and compare this figure across Education Level, Year of hire, and Part-Time vs Full Time status. Suggest a data-driven human relations strategy regarding which Education Level to hire. ce Wrap Text Gen Paste BI U BOA 3 Merge & Center $ $ Clipboard Font Alignment 5 B188 2017 B C D Year of Hire A 1 Employee ID 2 A1 3 A2 2014 4 A3 5 A4 6 A5 7 A6 8 A7 Part-Time/Full-Time FULL FULL FULL FULL PART FULL 2018 2017 2012 2010 2010 2010 2015 2015 2017 2015 2015 2014 9 A8 10 A9 Education Level 4. Bachelors 3. Associates 3. Associates 1. None 1. None 1. None 2. Diploma 2. Diploma 3. Associates 3. Associates 3. Associates 2. Diploma 2. Diploma 4. Bachelors 3. Associates 2. Diploma 3. Associates 2. Diploma 1. None 3. Associates 2. Diploma PART FULL FULL FULL FULL 11 A10 12 A11 13 A12 14 A13 15 A14 16 A15 17 A16 2014 2012 2018 2010 2013 FULL FULL FULL PART PART 18 A17 19 A18 20 A19 21 A20 PART FULL FULL 2015 22 A21 2018 2018 FULL FULL Paste BI UBA > Merge & Center ve LA % LZ Clipboard Nur 5 Alignment Font G17 fx B E F G D Hours Worked Calls Answered 149 1103 149 1058 149 1162 145 1218 96 413 140 868 70 179 1 Employee ID 2 A1 3 A2 4 A3 5 A4 6 A5 7 A6 8 A7 9 AS 10 A9 11 A10 12 A11 13 A12 14 A13 15 A14 16 A15 17 A16 18 A17 19 A18 20 A19 Month January January January January January January January January January January January January January January January January January January January January January 155 157 156 180 145 569 1267 992 879 1420 1022 1483 1134 540 496 180 60 80 75 645 173 1327 179 1647 847 21 A20 166 146 22 A21 1157 X LO Calibri 11 A A Paste BI U 1 a. Av Clipboard LZ Font IS B28 X fx D 1 Education Level 2 1. None 3 2. Diploma 4 3. Associates 5 4. Bachelors 6 B Education Increase 0% 5% 10% 15% 7 8 9 10 11 12 13 14 15 16 17 1 18 19 20 21 General Calibri - 11 - A A BIU OA Paste Wrap Text + Merge & Center $ %) *38-93 Conditional Format as Formatting Table Style Styles Clipboard Font Alignment Number B15 A B E D 3. Associates 1. None 2. Diploma 4. Bachelors 0 1 Years of Service 2 3 4 1 2 5 4 6 7 8 9 10 11 12 10 13 s S 10.00 0.80 14 15 Wake Agreement Factors 16 17 Base Wage 18 Seniority increase / Years of Service 19 20 Education Level 21 1. None 22 2. Diploma 23 3. Associates 24 4. Bachelors 25 Education Increase 0% 5% 10% 15% CASE 1: Call Center You are asked to measure the cost effectiveness of an employee group at a large call center. You have detailed information for each employee of the call center for 2019. The data consists of two tables: (1) Employee Data, which includes employees' hire date, level of education, and part-time vs full-time status; and (2) Operations Data, which includes how many hours employees worked each month and how many calls they answered during that month. The employees are paid an hourly wage based on their seniority (as determined by their year of hire) and their education level. Details of the agreement are provided in the worksheet "Hourly Wage Agreement". Calculate the Average Cost per Call for each employee and compare this figure across Education Level, Year of hire, and Part-Time vs Full Time status. Suggest a data-driven human relations strategy regarding which Education Level to hire. ce Wrap Text Gen Paste BI U BOA 3 Merge & Center $ $ Clipboard Font Alignment 5 B188 2017 B C D Year of Hire A 1 Employee ID 2 A1 3 A2 2014 4 A3 5 A4 6 A5 7 A6 8 A7 Part-Time/Full-Time FULL FULL FULL FULL PART FULL 2018 2017 2012 2010 2010 2010 2015 2015 2017 2015 2015 2014 9 A8 10 A9 Education Level 4. Bachelors 3. Associates 3. Associates 1. None 1. None 1. None 2. Diploma 2. Diploma 3. Associates 3. Associates 3. Associates 2. Diploma 2. Diploma 4. Bachelors 3. Associates 2. Diploma 3. Associates 2. Diploma 1. None 3. Associates 2. Diploma PART FULL FULL FULL FULL 11 A10 12 A11 13 A12 14 A13 15 A14 16 A15 17 A16 2014 2012 2018 2010 2013 FULL FULL FULL PART PART 18 A17 19 A18 20 A19 21 A20 PART FULL FULL 2015 22 A21 2018 2018 FULL FULL Paste BI UBA > Merge & Center ve LA % LZ Clipboard Nur 5 Alignment Font G17 fx B E F G D Hours Worked Calls Answered 149 1103 149 1058 149 1162 145 1218 96 413 140 868 70 179 1 Employee ID 2 A1 3 A2 4 A3 5 A4 6 A5 7 A6 8 A7 9 AS 10 A9 11 A10 12 A11 13 A12 14 A13 15 A14 16 A15 17 A16 18 A17 19 A18 20 A19 Month January January January January January January January January January January January January January January January January January January January January January 155 157 156 180 145 569 1267 992 879 1420 1022 1483 1134 540 496 180 60 80 75 645 173 1327 179 1647 847 21 A20 166 146 22 A21 1157 X LO Calibri 11 A A Paste BI U 1 a. Av Clipboard LZ Font IS B28 X fx D 1 Education Level 2 1. None 3 2. Diploma 4 3. Associates 5 4. Bachelors 6 B Education Increase 0% 5% 10% 15% 7 8 9 10 11 12 13 14 15 16 17 1 18 19 20 21 General Calibri - 11 - A A BIU OA Paste Wrap Text + Merge & Center $ %) *38-93 Conditional Format as Formatting Table Style Styles Clipboard Font Alignment Number B15 A B E D 3. Associates 1. None 2. Diploma 4. Bachelors 0 1 Years of Service 2 3 4 1 2 5 4 6 7 8 9 10 11 12 10 13 s S 10.00 0.80 14 15 Wake Agreement Factors 16 17 Base Wage 18 Seniority increase / Years of Service 19 20 Education Level 21 1. None 22 2. Diploma 23 3. Associates 24 4. Bachelors 25 Education Increase 0% 5% 10% 15%
Step by Step Solution
There are 3 Steps involved in it
Step: 1

Get Instant Access to Expert-Tailored Solutions
See step-by-step solutions with expert insights and AI powered tools for academic success
Step: 2

Step: 3
Ace Your Homework with AI
Get the answers you need in no time with our AI-driven, step-by-step assistance
Get Started
Management Audit A Complete Guide
Authors: Gerardus Blokdyk
2020 Edition
0655905413, 978-0655905417