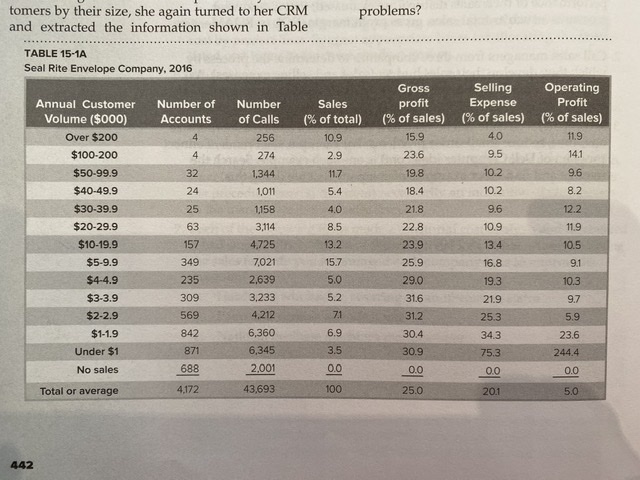
CASE 15-1 SEAL RITE ENVELOPE COMPANY (B) Profitability Analysis $ Rose Douglas, Seal Rite Envelope 15-1A. She did not like what she saw. She recalled Company's sales manager, scanned a print- a lecture in college given by an old marketing pro- out of a profitability analysis of the com- fessor who loved to talk about misdirected mar- pany's customers, she had in mind that a previous keting efforts. At the time, she thought that he was CRM analysis had indicated that the firm's direct hopelessly out of date. No firm in modern times selling costs per call were $110 for the company's could possibly allow such situations to develop. 522 million sales volume last year. Since the firm's Now she wished she had paid more attention to average gross margin was about 25 percent, the the lecture, for she suspected that she had a prob- salespeople had to get an average order of $140 for each sales call they made. Even then, a $140 average lem with just such misdirected marketing efforts. order just covered the direct selling expenses. That still left the overhead expenses uncovered. She could Questions: quickly see from the data in front of her that she had 1. What problems are indicated from the data in some problems. Table 15-1A? Wanting more data on the profitability of cus- 2. What should Rose Douglas do about those tomers by their size, she again turned to her CRM problems? and extracted the information shown in Table TABLE 13-14 Soal Rite Emclope Company. 2016 Gross Annual Customer Number of Number Sales Selling Operating Volume (5000) Accounts of Calls profit ( of total) Expense Profit (* of sales) [% of sales) ( of sales) Over $200 256 1519 4.0 119 $100-200 274 236 9.5 141 $50-99.9 1344 96 140-490 $30-39.5 25 10.2 218 $20-20.5 12 2 22 8 $10-19 9 4726 3.2 23. 7021 134 14-49 235 259 2:439 290tomers by their size, she again turned to her CRM problems? and extracted the information shown in Table TABLE 15-1A Seal Rite Envelope Company, 2016 Gross Selling Operating Annual Customer Number of Number Sales profit Expense Profit Volume ($000) Accounts of Calls (% of total) (% of sales) (% of sales) (% of sales) Over $200 4 256 10.9 15.9 4.0 11.9 $100-200 4 274 2.9 23.6 9.5 14.1 $50-99.9 32 1,344 11.7 19.8 10.2 9.6 $40-49.9 24 1,011 5.4 18.4 10.2 8.2 $30-39.9 25 1,158 4.0 21.8 9.6 12.2 $20-29.9 63 3,114 8.5 22.8 10.9 11.9 $10-19.9 157 4,725 13.2 23.9 13.4 10.5 $5-9.9 349 7021 15.7 25.9 16.8 91 $4-4.9 235 2.639 5.0 29.0 19.3 10.3 $3-3.9 309 3,233 5.2 31.6 21.9 9.7 $2-2.9 569 4.212 71 31.2 25.3 5.9 $1-1.9 842 6,360 6.9 30.4 34.3 23.6 Under $1 871 6,345 3.5 30.9 75.3 244.4 No sales 688 2,001 0.0 0.0 0.0 0.0 Total or average 4.172 43,693 100 25.0 201 5.0 442