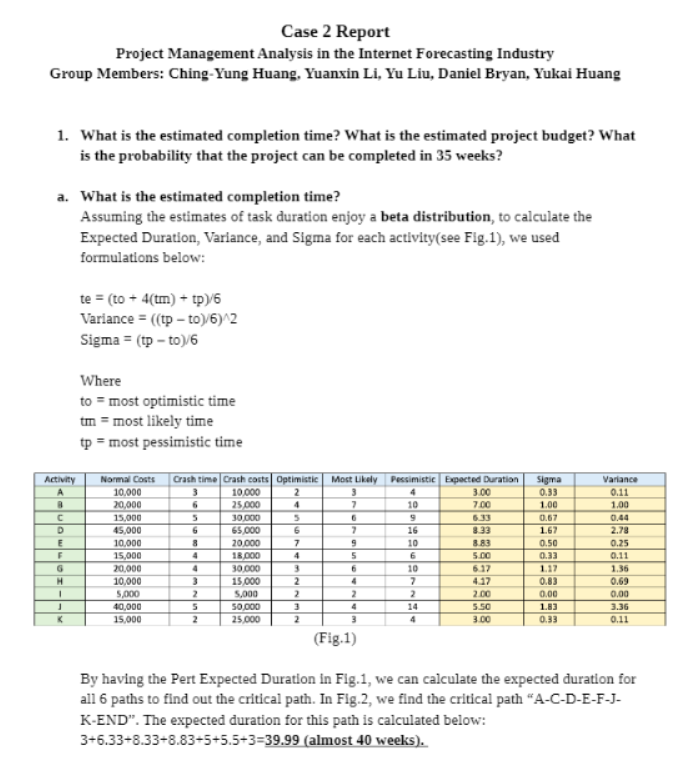
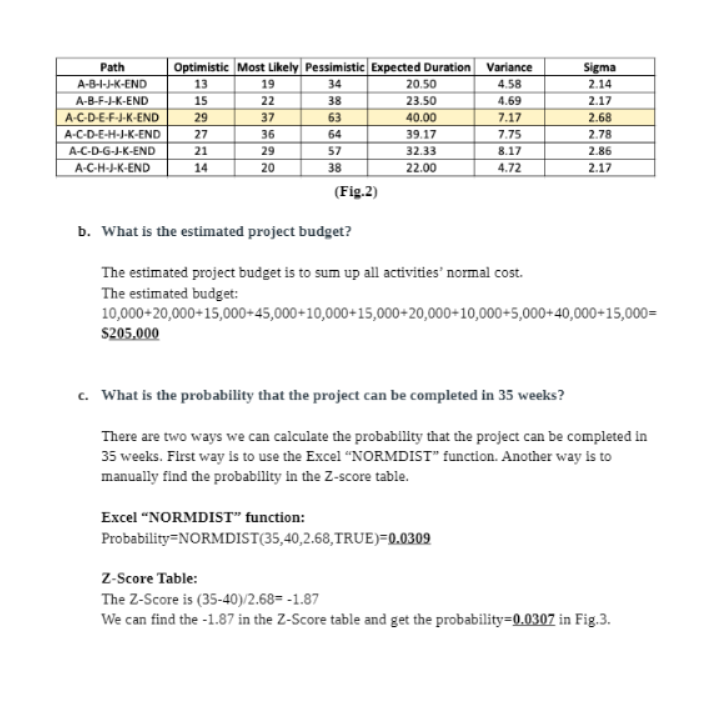
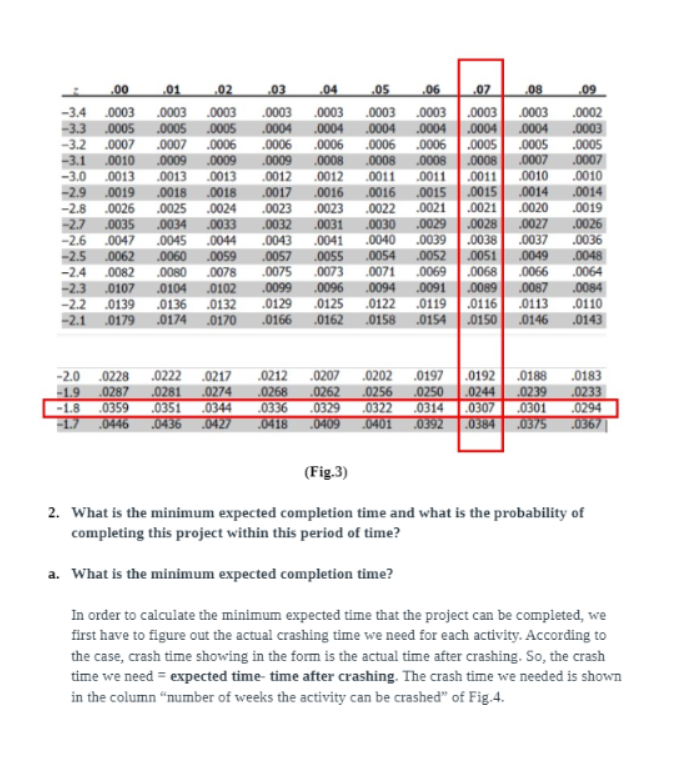
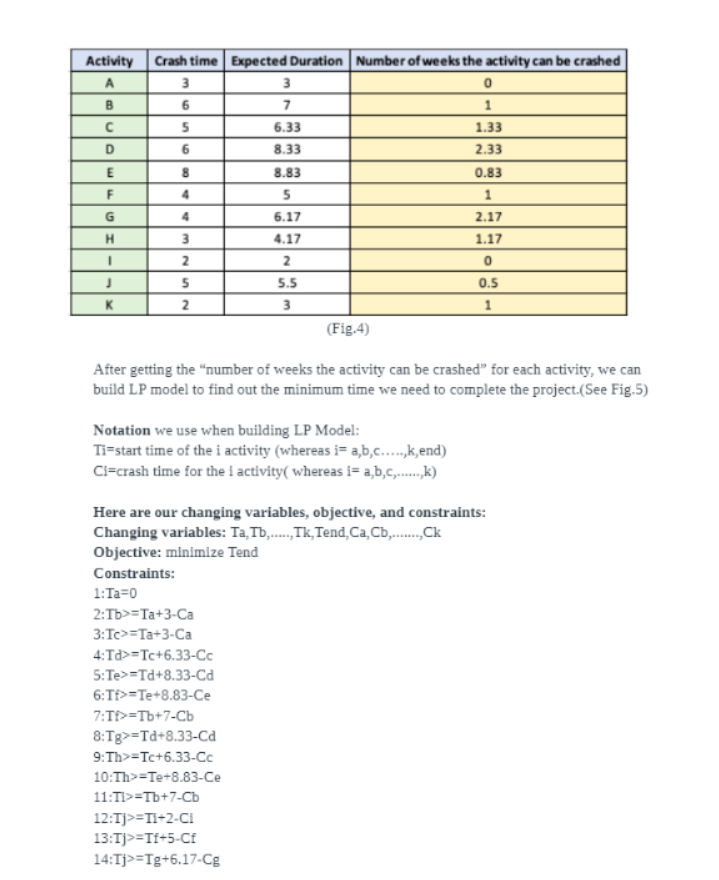
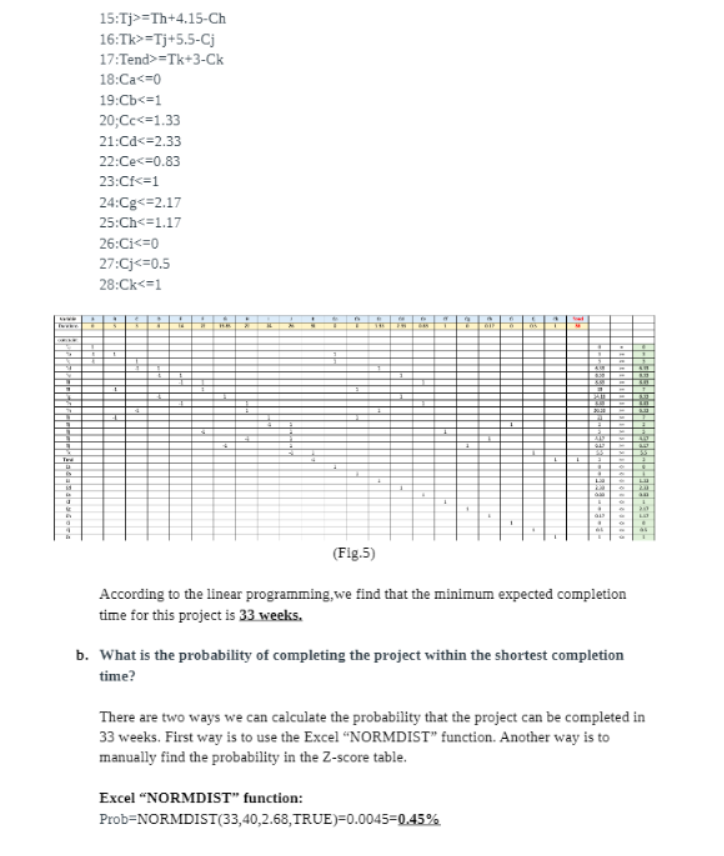
Case 2 Report Project Management Analysis in the Internet Forecasting Industry Group Members: Ching-Yung Huang, Yuanxin Li, Yu Liu, Daniel Bryan, Yukai Huang 1. What is the estimated completion time? What is the estimated project budget? What is the probability that the project can be completed in 35 weeks? a. What is the estimated completion time? Assuming the estimates of task duration enjoy a beta distribution, to calculate the Expected Duration, Variance, and Sigma for each activity(see Fig.1), we used formulations below: te = (to + 4(tm) + tp)/6 Variance = ((tp - to)/6)^2 Sigma = (tp - to)/6 Where to = most optimistic time tm = most likely time tp = most pessimistic time Activity Normal Costs Crash time Crash costs | Optimistic Most Likely Pessimistic Expected Duration Sigma Variance A 10.900 10/000 4 300 0.33 0.11 10,000 25,090 7.00 1.00 1.00 C 15,000 10,000 0.67 0.44 45,000 $5,000 8.33 167 2.78 10,000 20,000 8.83 0.50 0.25 15,000 18,000 5.00 0.33 0.11 20,008 30.090 10 6 17 117 1.36 10,008 15,000 4.17 0.83 0.69 5,000 5,000 2.00 0,00 DO'O 10,080 50,000 5.50 183 3.36 15,000 25,000 3.00 0.33 0,11 (Fig.1) By having the Pert Expected Duration In Fig.1, we can calculate the expected duration for all 6 paths to find out the critical path. In Fig.2, we find the critical path "A-C-D-E-F-J- K-END". The expected duration for this path is calculated below: 3+6.33+8.33+8.83+5+5.5+3=39.99 (almost 40 weeks).Path Optimistic Most Likely Pessimistic Expected Duration Variance Sigma A-D-4-J-K-END 13 19 34 20.50 4.58 2.14 A-B-F-J-K-END 15 22 38 23.50 1.69 2.17 A-C-D-E-F-J-K-END 29 37 63 40.00 7.17 .6 A-C-D-E-H-J-K-END 27 36 64 39.17 7.75 2.78 A-C-D-G-J-K-END 21 29 57 32.33 8.17 2.86 A-C-H-J-K-END 14 20 38 22.00 4.72 2.17 (Fig.2) b. What is the estimated project budget? The estimated project budget is to sum up all activities' normal cost. The estimated budget: 10,000+20,000+15,000+45,000+10,000+15,000+20,000+10,000+5,000+40,000+15,000= $205,000 c. What is the probability that the project can be completed in 35 weeks? There are two ways we can calculate the probability that the project can be completed in 35 weeks. First way is to use the Excel "NORMDIST" function. Another way is to manually find the probability In the Z-score table. Excel "NORMDIST" function: Probability=NORMDIST(35,40,2.68, TRUE)=0.0309 Z-Score Table: The Z-Score is (35-40)/2.68= -1.87 We can find the -1.87 in the Z-Score table and get the probability=0.0307 in Fig.3..00 -01 02 .03 .04 .05 -06 .07 0B 09 -3.4 0003 .0003 0003 0003 0003 0003 .0003 .0003 0003 .0002 -3.3 .0005 .0005 .0005 10004 0004 0004 .0004 .0004 .0004 .0003 -3.2 .0007 .0007 .0006 0006 0006 .0006 0006 .0005 .0005 0005 -3.1 10010 10009 10009 DO09 000B 10008 0008 .0008 0007 DO07 -3.0 .0013 .0013 .0013 0012 0012 0011 0011 .0011 0010 0010 -2.9 0019 0018 0018 0017 0016 0016 0015 .0015 0014 0014 -2.8 0026 .0025 .0024 .0023 .0023 0022 .0021 .0021 .0020 .0019 -2.7 0035 .0034 0033 0032 .0031 0030 0029 .0028 0027 .0026 -2.6 .0047 .0045 .0044 0043 .0041 .0040 .0039 .0038 .0037 .0036 -2.5 0062 0060 .0059 0057 0055 0054 10052 .0051 0049 .0048 -2.4 0082 .0080 .0078 0075 0073 0071 .0069 .0068 0066 .0064 -2.3 0107 .0104 .0102 0099 0096 0094 0091 .0089 0087 0084 -2.2 .0139 .0136 .0132 0129 .0125 .0122 .0119 .0116 0113 .0110 -2.1 .0179 .0174 .0170 .0166 0162 .0158 .0154 .0150 .0146 .0143 -2.0 -0228 .0222 0217 .0212 -0207 0202 .0197 .0192 .0188 .0183 -1.9 -0287 0281 0274 0268 0262 0256 0250 0244 0239 0233 -1.8 0359 .0351 .0344 .0336 0329 0322 .0314 -0307 .0301 0294 -1. .0446 .0436 .0427 .0418 .0409 .0401 0392 .0384 .0375 .0367 (Fig.3) 2. What is the minimum expected completion time and what is the probability of completing this project within this period of time? a. What is the minimum expected completion time? In order to calculate the minimum expected time that the project can be completed, we first have to figure out the actual crashing time we need for each activity. According to the case, crash time showing in the form is the actual time after crashing. So, the crash time we need = expected time- time after crashing. The crash time we needed is shown in the column "number of weeks the activity can be crashed" of Fig.4.Activity Crash time Expected Duration Number of weeks the activity can be crashed A 3 3 0 7 1 5 6.33 1.33 6 8.33 2.33 8.83 0.83 5 1 x - - I T mon 6.17 2.17 4.17 1.17 2 0 5.5 0.5 3 1 (Fig.4) After getting the "number of weeks the activity can be crashed" for each activity, we can build LP model to find out the minimum time we need to complete the project.(See Fig.5) Notation we use when building LP Model: Ti=start time of the i activity (whereas i= a,b,c.....,k,end) Ci=crash time for the I activity( whereas i= a,b,c,....,k) Here are our changing variables, objective, and constraints: Changing variables: Ta, Tb,....., Tk, Tend, Ca, Cb,....., Ck Objective: minimize Tend Constraints: 1:Ta=0 2:Tb>=Ta+3-Ca 3:Tc>=Ta+3-Ca 4:Td>=Tc+6.33-Cc 5:Te>=Td+8.33-Cd 6:If>=Te+8.83-Ce 7:If>=Tb+7-Cb 8:Tg>=Td+8.33-Cd 9:Th>=Tc+6.33-Cc 10:Th>=Te+8.83-Ce 11:11>=Tb+7-Cb 12:1]>=TI+2-CI 13:T]>=If+5-Cf 14:1j>=Tg+6.17-Cg15:Tj>=Th+4.15-Ch 16:Tk>=Tj+5.5-Cj 17:Tend>=Tk+3-Ck 18:Ca
