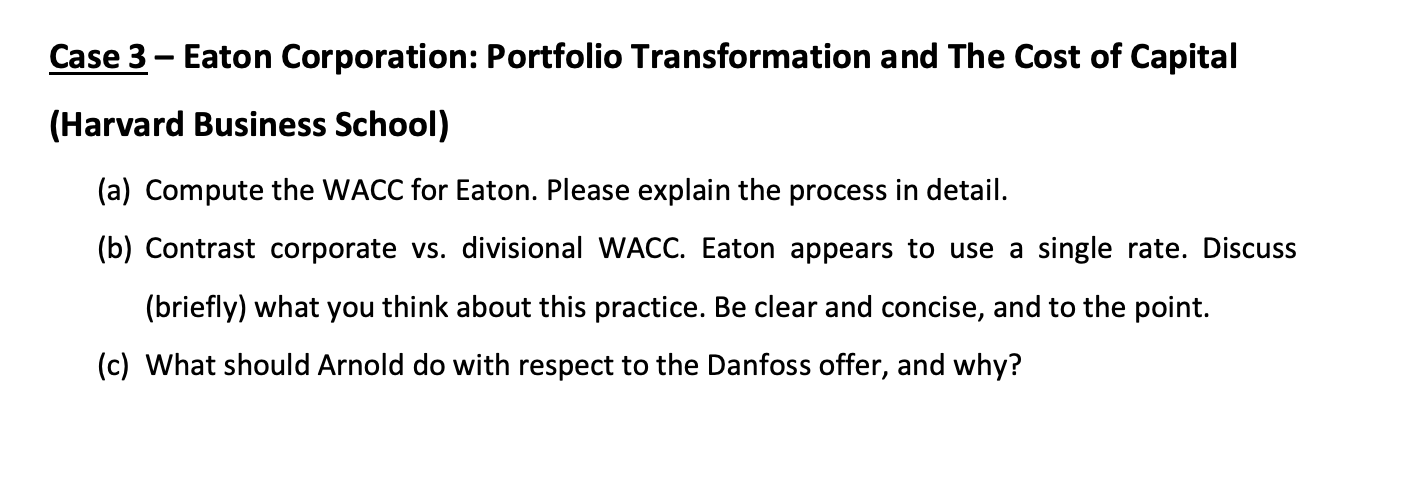
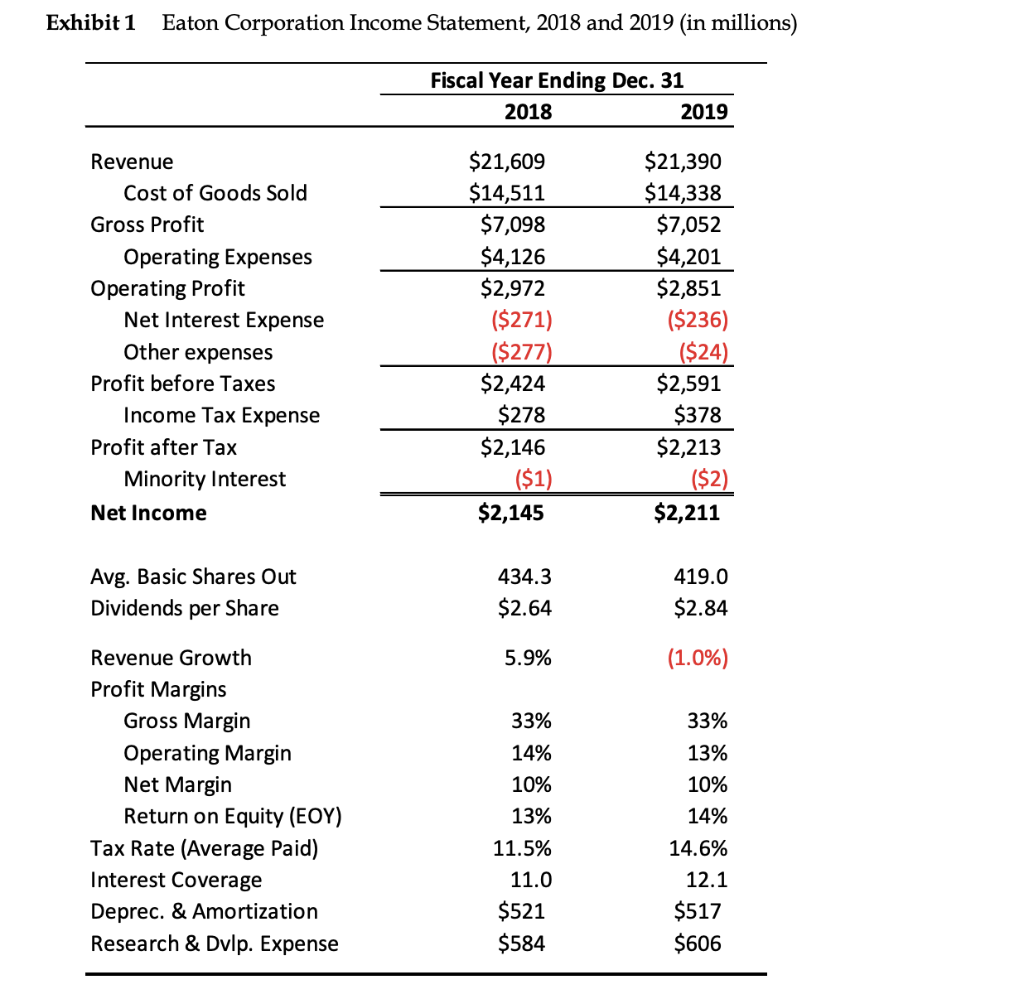
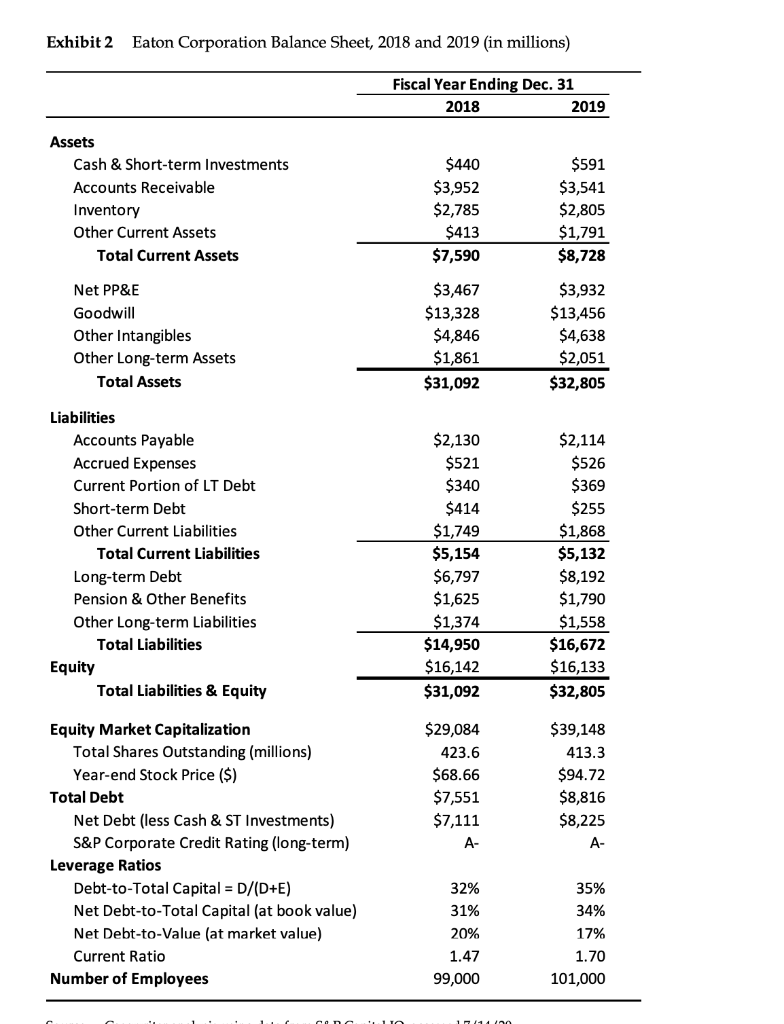
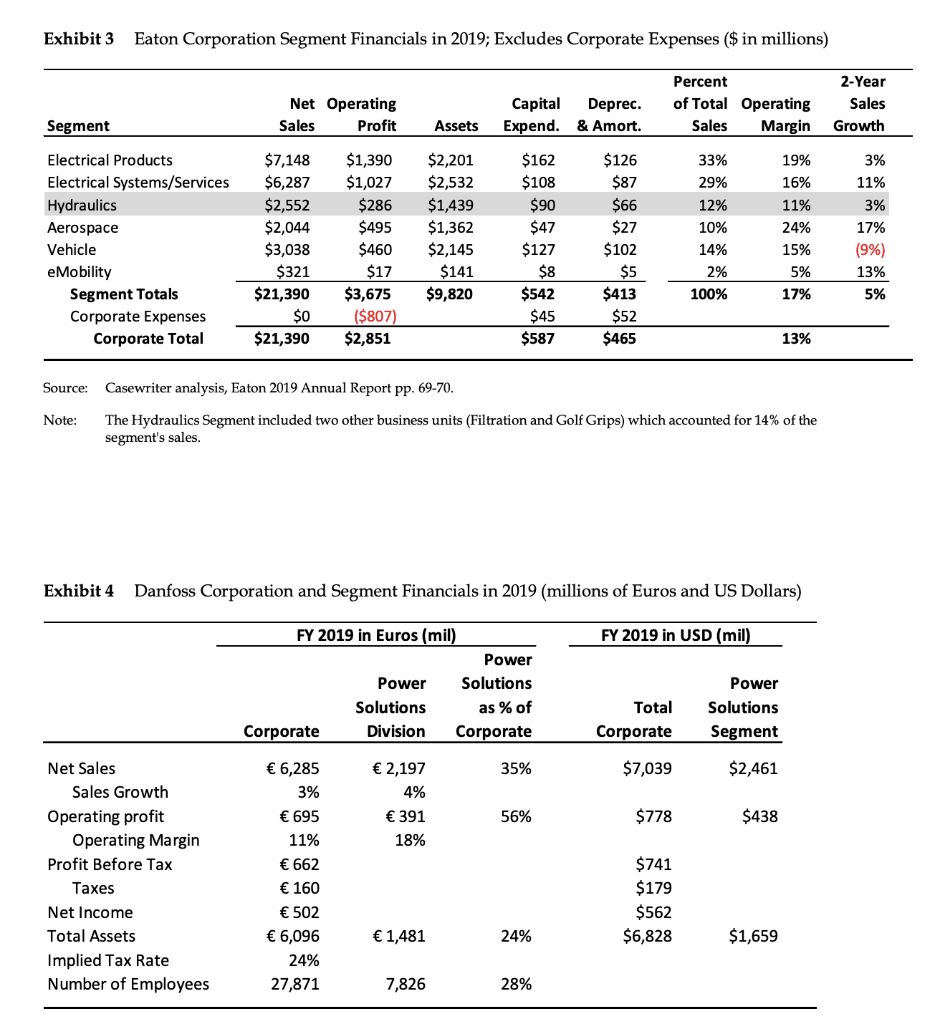
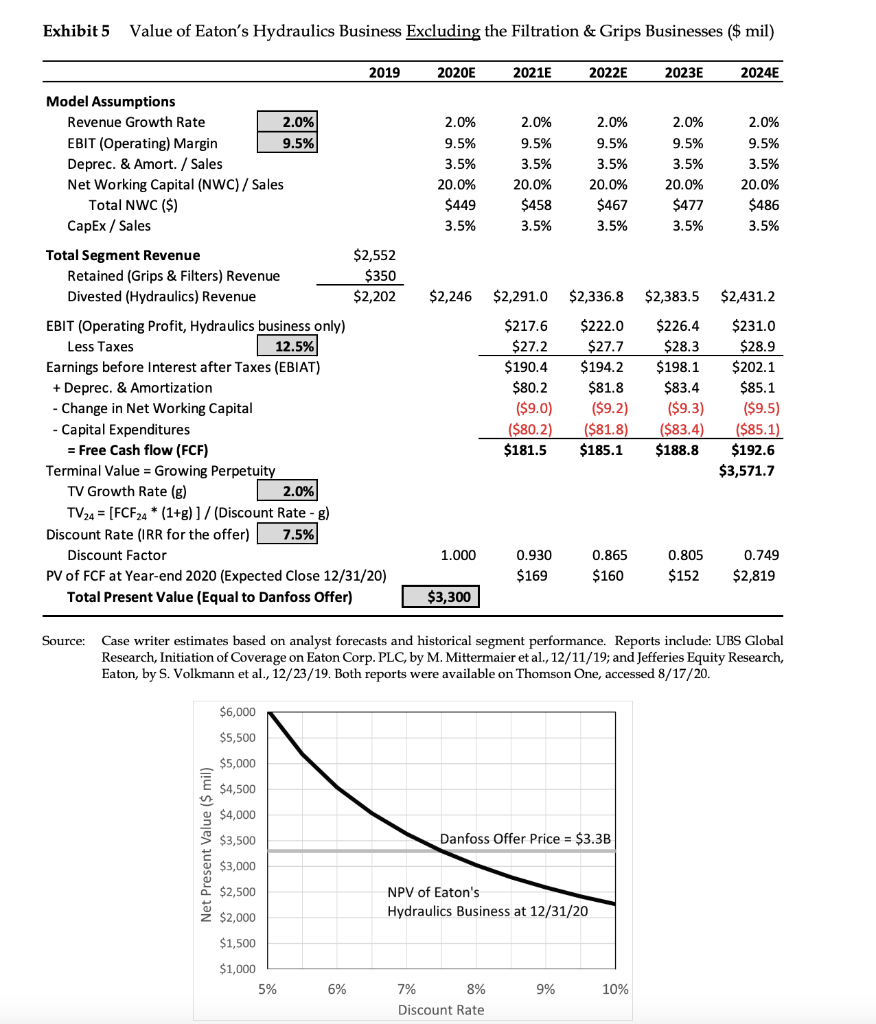
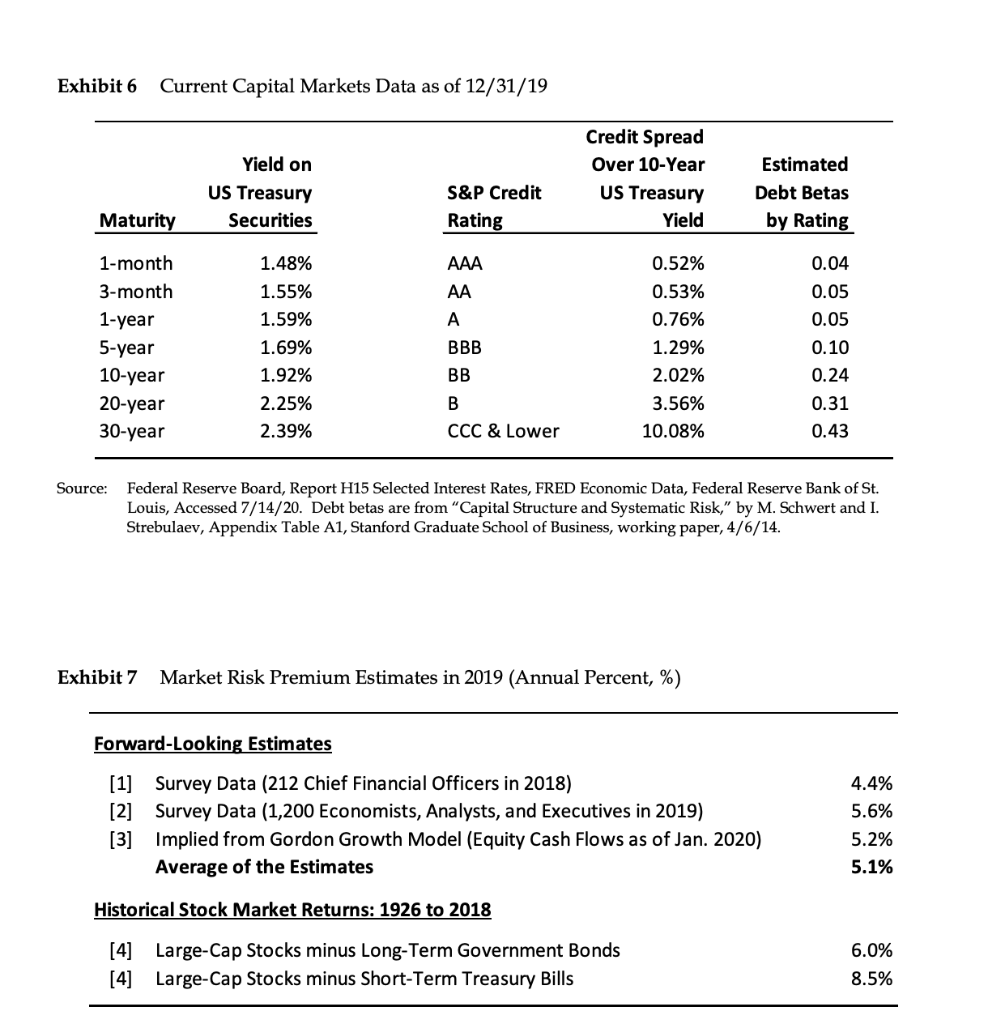
Case 3 Eaton Corporation: Portfolio Transformation and The Cost of Capital (Harvard Business School) (a) Compute the WACC for Eaton. Please explain the process in detail. (b) Contrast corporate vs. divisional WACC. Eaton appears to use a single rate. Discuss (briefly) what you think about this practice. Be clear and concise, and to the point. (c) What should Arnold do with respect to the Danfoss offer, and why? Exhibit 1 Eaton Corporation Income Statement, 2018 and 2019 (in millions) Fiscal Year Ending Dec. 31 2018 2019 Revenue Cost of Goods Sold Gross Profit Operating Expenses Operating Profit Net Interest Expense Other expenses Profit before Taxes Income Tax Expense Profit after Tax Minority Interest Net Income $21,609 $14,511 $7,098 $4,126 $2,972 ($271) ($277) $2,424 $278 $2,146 ($1) $2,145 $21,390 $14,338 $7,052 $4,201 $2,851 ($236) ($24) $2,591 $378 $2,213 ($2) $2,211 Avg. Basic Shares Out Dividends per Share 434.3 $2.64 419.0 $2.84 5.9% (1.0%) Revenue Growth Profit Margins Gross Margin Operating Margin Net Margin Return on Equity (EOY) Tax Rate (Average Paid) Interest Coverage Deprec. & Amortization Research & Dvip. Expense 33% 14% 10% 13% 33% 13% 10% 14% 14.6% 12.1 $517 $606 11.5% 11.0 $521 $584 Exhibit 2 Eaton Corporation Balance Sheet, 2018 and 2019 (in millions) Fiscal Year Ending Dec. 31 2018 2019 Assets Cash & Short-term Investments Accounts Receivable Inventory Other Current Assets Total Current Assets $440 $3,952 $2,785 $413 $7,590 $591 $3,541 $2,805 $1,791 $8,728 Net PP&E Goodwill Other Intangibles Other Long-term Assets Total Assets $3,467 $13,328 $4,846 $1,861 $31,092 $3,932 $13,456 $4,638 $2,051 $32,805 Liabilities Accounts Payable Accrued Expenses Current Portion of LT Debt Short-term Debt Other Current Liabilities Total Current Liabilities Long-term Debt Pension & Other Benefits Other Long-term Liabilities Total Liabilities Equity Total Liabilities & Equity $2,130 $521 $340 $414 $1,749 $5,154 $6,797 $1,625 $1,374 $14,950 $16,142 $31,092 $2,114 $526 $369 $255 $1,868 $5,132 $8,192 $1,790 $1,558 $16,672 $16,133 $32,805 $29,084 423.6 $68.66 $7,551 $7,111 A- $39,148 413.3 $94.72 $8,816 $8,225 A- Equity Market Capitalization Total Shares Outstanding (millions) Year-end Stock Price ($) Total Debt Net Debt (less Cash & ST Investments) S&P Corporate Credit Rating (long-term) Leverage Ratios Debt-to-Total Capital = D/(D+E) Net Debt-to-Total Capital (at book value) Net Debt-to-Value (at market value) Current Ratio Number of Employees 32% 31% 20% 1.47 99,000 35% 34% 17% 1.70 101,000 10 Exhibit 3 Eaton Corporation Segment Financials in 2019; Excludes Corporate Expenses ($ in millions) Net Operating Sales Profit Capital Deprec. Expend. & Amort. Percent of Total Operating Sales Margin 2-Year Sales Growth Segment Assets Electrical Products Electrical Systems/Services Hydraulics Aerospace Vehicle eMobility Segment Totals Corporate Expenses Corporate Total $7,148 $6,287 $2,552 $2,044 $3,038 $321 $21,390 $0 $21,390 $1,390 $1,027 $286 $495 $460 $17 $3,675 ($807) $2,851 $2,201 $2,532 $1,439 $1,362 $2,145 $141 $9,820 $162 $108 $90 $47 $127 $8 $542 $45 $587 $126 $87 $66 $27 $102 $5 $413 $52 $465 33% 29% 12% 10% 14% 2% 100% 19% 16% 11% 24% 15% 5% 17% 3% 11% 3% 17% (9%) 13% 5% 13% Source: Casewriter analysis, Eaton 2019 Annual Report pp. 69-70. Note: The Hydraulics Segment included two other business units (Filtration and Golf Grips) which accounted for 14% of the segment's sales. Exhibit 4 Danfoss Corporation and Segment Financials in 2019 (millions of Euros and US Dollars) FY 2019 in USD (mil) FY 2019 in Euros (mil) Power Power Solutions Solutions as % of Corporate Division Corporate Total Corporate Power Solutions Segment 35% $7,039 $2,461 2,197 4% 391 18% 56% $778 $438 Net Sales Sales Growth Operating profit Operating Margin Profit Before Tax Taxes Net Income Total Assets Implied Tax Rate Number of Employees 6,285 3% 695 11% 662 160 502 6,096 24% 27,871 $741 $179 $562 $6,828 1,481 24% $1,659 7,826 28% Exhibit 5 Value of Eaton's Hydraulics Business Excluding the Filtration & Grips Businesses ($ mil) 2019 2020E 2021E 2022E 2023E 2024E Model Assumptions Revenue Growth Rate 2.0% EBIT (Operating) Margin 9.5% Deprec. & Amort / Sales Net Working Capital (NWC)/ Sales Total NWC ($) CapEx / Sales 2.0% 9.5% 3.5% 20.0% $449 3.5% 2.0% 9.5% 3.5% 20.0% $458 3.5% 2.0% 9.5% 3.5% 20.0% $467 3.5% 2.0% 9.5% 3.5% 20.0% $477 3.5% 2.0% 9.5% 3.5% 20.0% $486 3.5% $2,246 $2,291.0 $2,336.8 $2,383.5 $2,431.2 Total Segment Revenue $2,552 Retained (Grips & Filters) Revenue $350 Divested (Hydraulics) Revenue $2,202 EBIT (Operating Profit, Hydraulics business only) Less Taxes 12.5% Earnings before Interest after Taxes (EBIAT) + Deprec. & Amortization Change in Net Working Capital Capital Expenditures = Free Cash flow (FCF) Terminal Value = Growing Perpetuity TV Growth Rate (g) 2.0% TV24 = [FCF24 * (1+g)]/(Discount Rate - g) Discount Rate (IRR for the offer) 7.5% Discount Factor PV of FCF at Year-end 2020 (Expected Close 12/31/20) Total Present Value (Equal to Danfoss Offer) $217.6 $27.2 $190.4 $80.2 ($9.0) ($80.2) $181.5 $222.0 $27.7 $194.2 $81.8 ($9.2) ($81.8) $185.1 $226.4 $28.3 $198.1 $83.4 ($9.3) ($83.4) $188.8 $231.0 $28.9 $202.1 $85.1 ($9.5) ($85.1) $192.6 $3,571.7 1.000 0.930 $169 0.865 $160 0.805 $152 0.749 $2,819 $3,300 Source: Case writer estimates based on analyst forecasts and historical segment performance. Reports include: UBS Global Research, Initiation of Coverage on Eaton Corp.PLC, by M. Mittermaier et al., 12/11/19; and Jefferies Equity Research, Eaton, by S. Volkmann et al., 12/23/19. Both reports were available on Thomson One, accessed 8/17/20. $6,000 $5,500 $5,000 $4,500 $4,000 Net Present Value ($ mil) $3,500 Danfoss Offer Price = $3.3B $3,000 $2,500 NPV of Eaton's Hydraulics Business at 12/31/20 $2,000 $1,500 $1,000 5% 6% 9% 10% 7% 8% Discount Rate Exhibit 6 Current Capital Markets Data as of 12/31/19 Yield on US Treasury Securities Credit Spread Over 10-Year US Treasury Yield S&P Credit Rating Estimated Debt Betas by Rating Maturity AAA AA A 1-month 3-month 1-year 5-year 10-year 20-year 30-year 1.48% 1.55% 1.59% 1.69% 1.92% 2.25% 2.39% BBB BB 0.52% 0.53% 0.76% 1.29% 2.02% 3.56% 10.08% 0.04 0.05 0.05 0.10 0.24 0.31 0.43 B CCC & Lower Source: Federal Reserve Board, Report H15 Selected Interest Rates, FRED Economic Data, Federal Reserve Bank of St. Louis, Accessed 7/14/20. Debt betas are from "Capital Structure and Systematic Risk," by M. Schwert and I. Strebulaev, Appendix Table A1, Stanford Graduate School of Business, working paper, 4/6/14. Exhibit 7 Market Risk Premium Estimates in 2019 (Annual Percent, %) Forward-looking Estimates 4.4% 5.6% [1] Survey Data (212 Chief Financial Officers in 2018) [2] Survey Data (1,200 Economists, Analysts, and Executives in 2019) [3] Implied from Gordon Growth Model (Equity Cash Flows as of Jan. 2020) Average of the Estimates 5.2% 5.1% Historical Stock Market Returns: 1926 to 2018 [4] Large-Cap Stocks minus Long-Term Government Bonds [4] Large-Cap Stocks minus Short-Term Treasury Bills 6.0% 8.5% Case 3 Eaton Corporation: Portfolio Transformation and The Cost of Capital (Harvard Business School) (a) Compute the WACC for Eaton. Please explain the process in detail. (b) Contrast corporate vs. divisional WACC. Eaton appears to use a single rate. Discuss (briefly) what you think about this practice. Be clear and concise, and to the point. (c) What should Arnold do with respect to the Danfoss offer, and why? Exhibit 1 Eaton Corporation Income Statement, 2018 and 2019 (in millions) Fiscal Year Ending Dec. 31 2018 2019 Revenue Cost of Goods Sold Gross Profit Operating Expenses Operating Profit Net Interest Expense Other expenses Profit before Taxes Income Tax Expense Profit after Tax Minority Interest Net Income $21,609 $14,511 $7,098 $4,126 $2,972 ($271) ($277) $2,424 $278 $2,146 ($1) $2,145 $21,390 $14,338 $7,052 $4,201 $2,851 ($236) ($24) $2,591 $378 $2,213 ($2) $2,211 Avg. Basic Shares Out Dividends per Share 434.3 $2.64 419.0 $2.84 5.9% (1.0%) Revenue Growth Profit Margins Gross Margin Operating Margin Net Margin Return on Equity (EOY) Tax Rate (Average Paid) Interest Coverage Deprec. & Amortization Research & Dvip. Expense 33% 14% 10% 13% 33% 13% 10% 14% 14.6% 12.1 $517 $606 11.5% 11.0 $521 $584 Exhibit 2 Eaton Corporation Balance Sheet, 2018 and 2019 (in millions) Fiscal Year Ending Dec. 31 2018 2019 Assets Cash & Short-term Investments Accounts Receivable Inventory Other Current Assets Total Current Assets $440 $3,952 $2,785 $413 $7,590 $591 $3,541 $2,805 $1,791 $8,728 Net PP&E Goodwill Other Intangibles Other Long-term Assets Total Assets $3,467 $13,328 $4,846 $1,861 $31,092 $3,932 $13,456 $4,638 $2,051 $32,805 Liabilities Accounts Payable Accrued Expenses Current Portion of LT Debt Short-term Debt Other Current Liabilities Total Current Liabilities Long-term Debt Pension & Other Benefits Other Long-term Liabilities Total Liabilities Equity Total Liabilities & Equity $2,130 $521 $340 $414 $1,749 $5,154 $6,797 $1,625 $1,374 $14,950 $16,142 $31,092 $2,114 $526 $369 $255 $1,868 $5,132 $8,192 $1,790 $1,558 $16,672 $16,133 $32,805 $29,084 423.6 $68.66 $7,551 $7,111 A- $39,148 413.3 $94.72 $8,816 $8,225 A- Equity Market Capitalization Total Shares Outstanding (millions) Year-end Stock Price ($) Total Debt Net Debt (less Cash & ST Investments) S&P Corporate Credit Rating (long-term) Leverage Ratios Debt-to-Total Capital = D/(D+E) Net Debt-to-Total Capital (at book value) Net Debt-to-Value (at market value) Current Ratio Number of Employees 32% 31% 20% 1.47 99,000 35% 34% 17% 1.70 101,000 10 Exhibit 3 Eaton Corporation Segment Financials in 2019; Excludes Corporate Expenses ($ in millions) Net Operating Sales Profit Capital Deprec. Expend. & Amort. Percent of Total Operating Sales Margin 2-Year Sales Growth Segment Assets Electrical Products Electrical Systems/Services Hydraulics Aerospace Vehicle eMobility Segment Totals Corporate Expenses Corporate Total $7,148 $6,287 $2,552 $2,044 $3,038 $321 $21,390 $0 $21,390 $1,390 $1,027 $286 $495 $460 $17 $3,675 ($807) $2,851 $2,201 $2,532 $1,439 $1,362 $2,145 $141 $9,820 $162 $108 $90 $47 $127 $8 $542 $45 $587 $126 $87 $66 $27 $102 $5 $413 $52 $465 33% 29% 12% 10% 14% 2% 100% 19% 16% 11% 24% 15% 5% 17% 3% 11% 3% 17% (9%) 13% 5% 13% Source: Casewriter analysis, Eaton 2019 Annual Report pp. 69-70. Note: The Hydraulics Segment included two other business units (Filtration and Golf Grips) which accounted for 14% of the segment's sales. Exhibit 4 Danfoss Corporation and Segment Financials in 2019 (millions of Euros and US Dollars) FY 2019 in USD (mil) FY 2019 in Euros (mil) Power Power Solutions Solutions as % of Corporate Division Corporate Total Corporate Power Solutions Segment 35% $7,039 $2,461 2,197 4% 391 18% 56% $778 $438 Net Sales Sales Growth Operating profit Operating Margin Profit Before Tax Taxes Net Income Total Assets Implied Tax Rate Number of Employees 6,285 3% 695 11% 662 160 502 6,096 24% 27,871 $741 $179 $562 $6,828 1,481 24% $1,659 7,826 28% Exhibit 5 Value of Eaton's Hydraulics Business Excluding the Filtration & Grips Businesses ($ mil) 2019 2020E 2021E 2022E 2023E 2024E Model Assumptions Revenue Growth Rate 2.0% EBIT (Operating) Margin 9.5% Deprec. & Amort / Sales Net Working Capital (NWC)/ Sales Total NWC ($) CapEx / Sales 2.0% 9.5% 3.5% 20.0% $449 3.5% 2.0% 9.5% 3.5% 20.0% $458 3.5% 2.0% 9.5% 3.5% 20.0% $467 3.5% 2.0% 9.5% 3.5% 20.0% $477 3.5% 2.0% 9.5% 3.5% 20.0% $486 3.5% $2,246 $2,291.0 $2,336.8 $2,383.5 $2,431.2 Total Segment Revenue $2,552 Retained (Grips & Filters) Revenue $350 Divested (Hydraulics) Revenue $2,202 EBIT (Operating Profit, Hydraulics business only) Less Taxes 12.5% Earnings before Interest after Taxes (EBIAT) + Deprec. & Amortization Change in Net Working Capital Capital Expenditures = Free Cash flow (FCF) Terminal Value = Growing Perpetuity TV Growth Rate (g) 2.0% TV24 = [FCF24 * (1+g)]/(Discount Rate - g) Discount Rate (IRR for the offer) 7.5% Discount Factor PV of FCF at Year-end 2020 (Expected Close 12/31/20) Total Present Value (Equal to Danfoss Offer) $217.6 $27.2 $190.4 $80.2 ($9.0) ($80.2) $181.5 $222.0 $27.7 $194.2 $81.8 ($9.2) ($81.8) $185.1 $226.4 $28.3 $198.1 $83.4 ($9.3) ($83.4) $188.8 $231.0 $28.9 $202.1 $85.1 ($9.5) ($85.1) $192.6 $3,571.7 1.000 0.930 $169 0.865 $160 0.805 $152 0.749 $2,819 $3,300 Source: Case writer estimates based on analyst forecasts and historical segment performance. Reports include: UBS Global Research, Initiation of Coverage on Eaton Corp.PLC, by M. Mittermaier et al., 12/11/19; and Jefferies Equity Research, Eaton, by S. Volkmann et al., 12/23/19. Both reports were available on Thomson One, accessed 8/17/20. $6,000 $5,500 $5,000 $4,500 $4,000 Net Present Value ($ mil) $3,500 Danfoss Offer Price = $3.3B $3,000 $2,500 NPV of Eaton's Hydraulics Business at 12/31/20 $2,000 $1,500 $1,000 5% 6% 9% 10% 7% 8% Discount Rate Exhibit 6 Current Capital Markets Data as of 12/31/19 Yield on US Treasury Securities Credit Spread Over 10-Year US Treasury Yield S&P Credit Rating Estimated Debt Betas by Rating Maturity AAA AA A 1-month 3-month 1-year 5-year 10-year 20-year 30-year 1.48% 1.55% 1.59% 1.69% 1.92% 2.25% 2.39% BBB BB 0.52% 0.53% 0.76% 1.29% 2.02% 3.56% 10.08% 0.04 0.05 0.05 0.10 0.24 0.31 0.43 B CCC & Lower Source: Federal Reserve Board, Report H15 Selected Interest Rates, FRED Economic Data, Federal Reserve Bank of St. Louis, Accessed 7/14/20. Debt betas are from "Capital Structure and Systematic Risk," by M. Schwert and I. Strebulaev, Appendix Table A1, Stanford Graduate School of Business, working paper, 4/6/14. Exhibit 7 Market Risk Premium Estimates in 2019 (Annual Percent, %) Forward-looking Estimates 4.4% 5.6% [1] Survey Data (212 Chief Financial Officers in 2018) [2] Survey Data (1,200 Economists, Analysts, and Executives in 2019) [3] Implied from Gordon Growth Model (Equity Cash Flows as of Jan. 2020) Average of the Estimates 5.2% 5.1% Historical Stock Market Returns: 1926 to 2018 [4] Large-Cap Stocks minus Long-Term Government Bonds [4] Large-Cap Stocks minus Short-Term Treasury Bills 6.0% 8.5%