 Case 3.2 The Prime constractors.
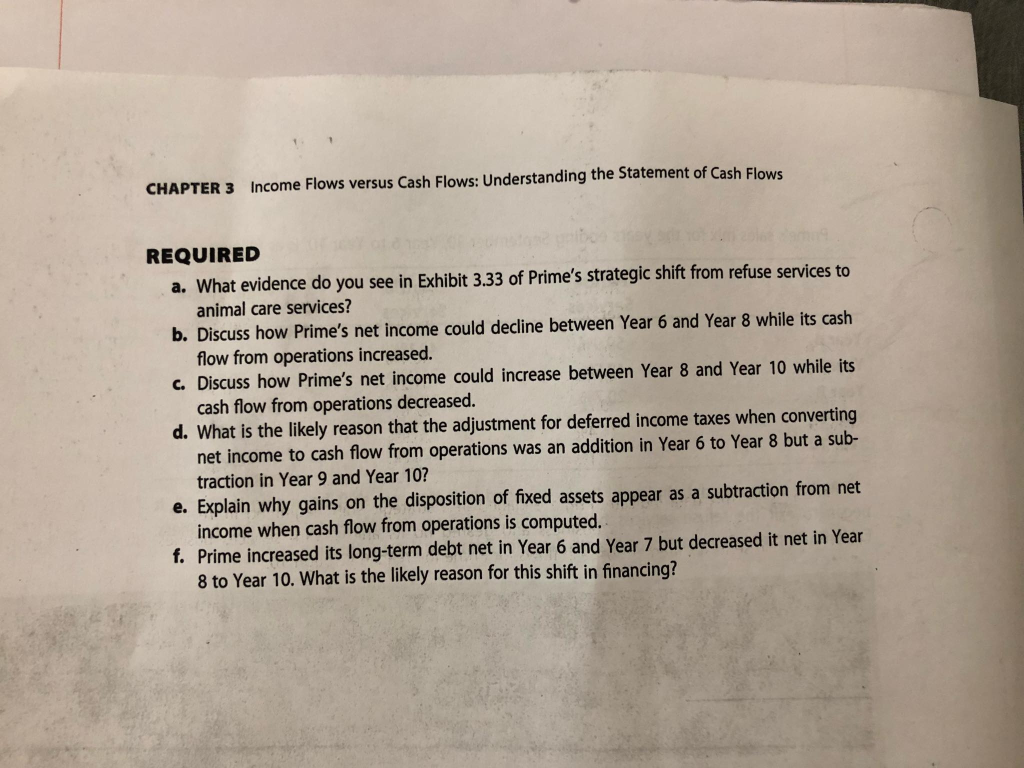
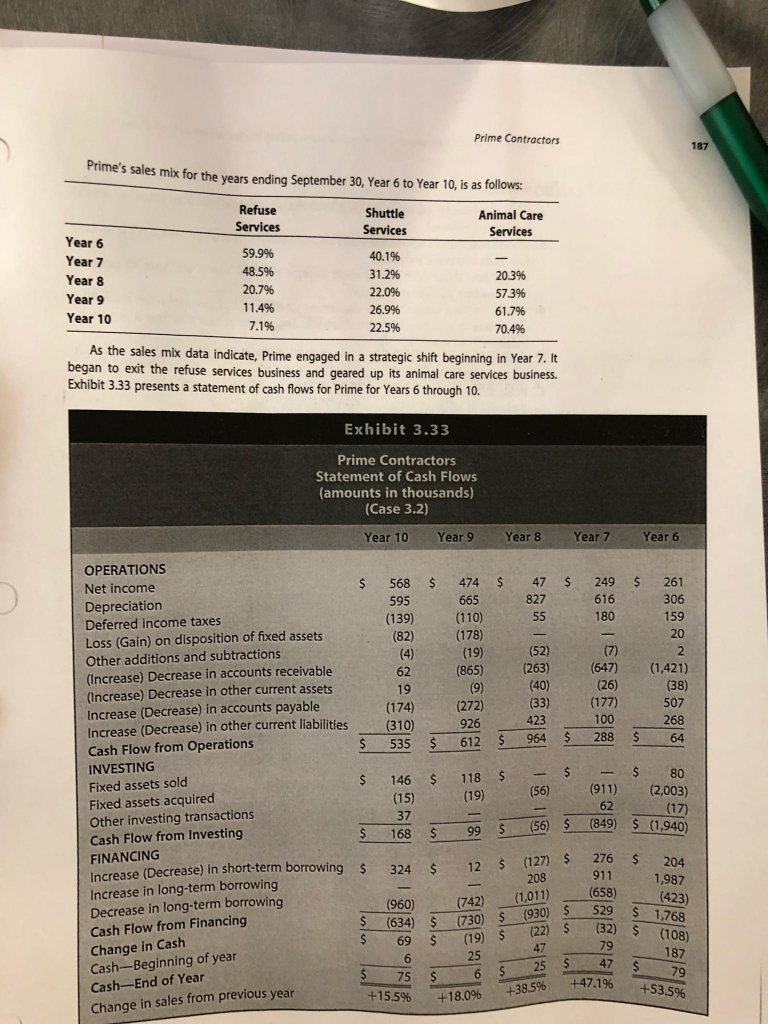
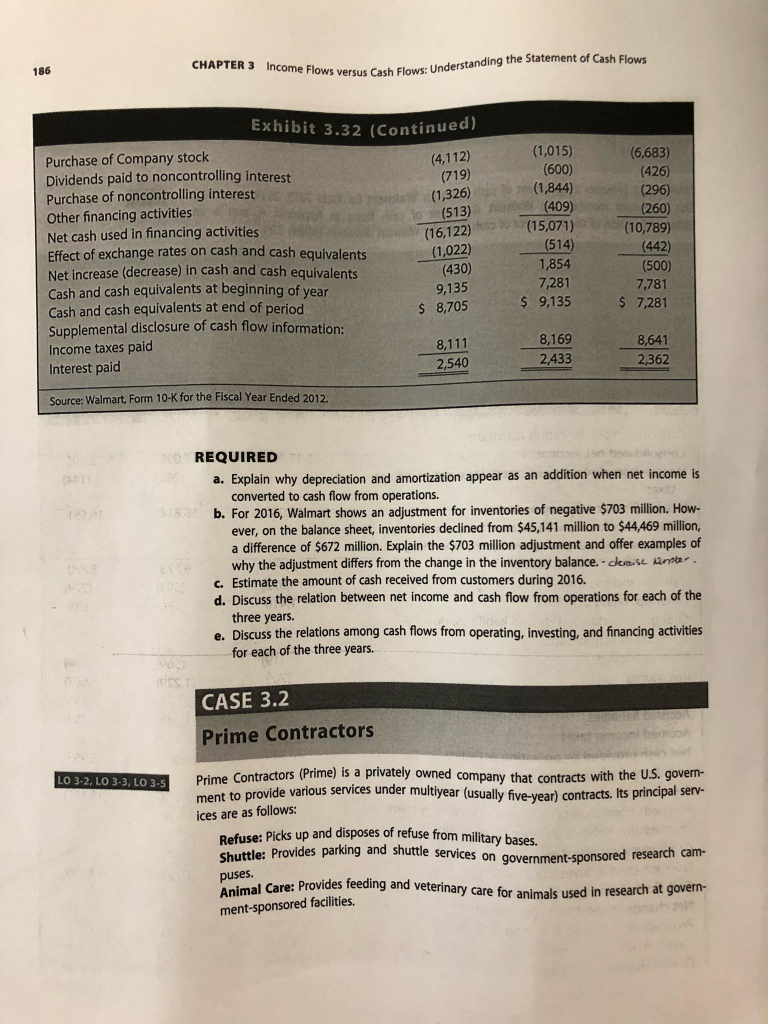
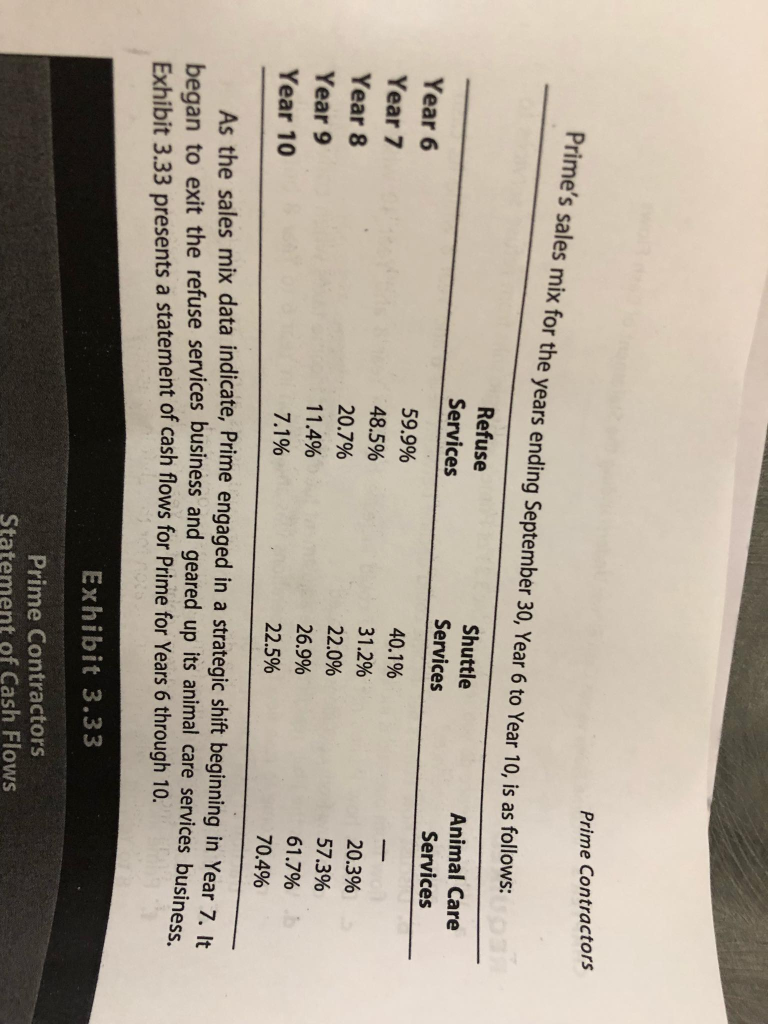
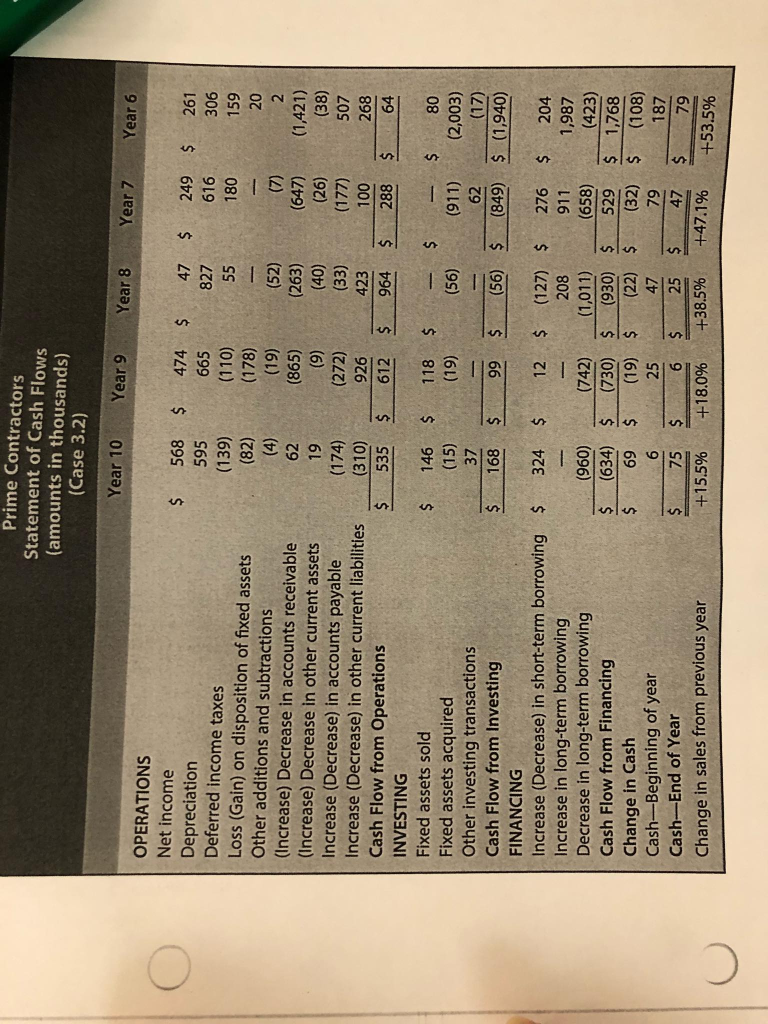
CHAPTER 3 Income Flows versus Cash Flows: Understanding the Statement of Cash Flows REQUIRED a. What evidence do you see in Exhibit 3.33 of Prime's strategic shift from refuse services to b. Discuss how Prime's net income could decline between Year 6 and Year 8 while its cash c. Discuss how Prime's net income could increase between Year 8 and Year 10 while its d. What is the likely reason that the adjustment for deferred income taxes when converting animal care services? flow from operations increased. cash flow from operations decreased. net income to cash flow from operations was an addition in Year 6 to Year 8 but a sub- traction in Year 9 and Year 10? income when cash flow from operations is computed. 8 to Year 10. What is the likely reason for this shift in financing? e. Explain why gains on the disposition of fixed assets appear as a subtraction from net f. Prime increased its long-term debt net in Year 6 and Year 7 but decreased it net in Year Prime Contractors 187 Prime's sales mix for the years ending September 30, Year 6 to Year 10, is as follows Refuse Services Shuttle Animal Care Services Year 8 Year 9 Year 10 59.9% 48.5% 20.7% 11.4% 7.1% 31.2% 22.0% 26,9% 22.5% 20.3% 573% 61.7% 70.4% the sales mix data indicate, Prime engaged in a strategic shift beginning in Year 7. It began to exit the refuse services business and geared up its animal care services business 3.33 presents a statement of cash flows for Prime for Years 6 through 10 Exhibit 3.33 Prime Contractors Statement of Cash Flows (amounts in thousands) Case 3.2) Year 10 Year 9Year 8 Year 7 Year 6 OPERATIONS Net income Depreciation Deferred income taxes Loss (Gain) on disposition of fixed assets Other additions and subtractions (Increase) Decrease in accounts receivable (Increase) Decrease in other current assets Increase (Decrease) in accounts payable Increase (Decrease) in other current liabilities Cash Flow from Operations INVESTING Fixed assets sold Fixed assets acquired Other investing transactions Cash Flow from Investing FINANCING $ 568 474 $ 47 $ 249 $ 261 595 (139) (110) (82) 827616 (52) (263) 2 (865) (647) (1,421) 19 (174) (310) (272) 926 (33) 423 (177) 100 507 268 64 5 535 $ 612 S 964 288 $ 146 $ 118 $ (56) (911) (2,003) $ 168 99 (56 (849) $ (1940) $ 276 $ 204 1,987 (Decrease) in short-term borrowing $ 324 12 $ (127) Increase in long-term borrowing Decrease in long-term borrowing Cash Flow from Financing Change in Cash Cash- Beginning of year Cash-End of Year Change in sales from previous year 658 (960) (742) (1,011 S(634) (730(30 $29 (19(22) (82) +38.5% +47.1% +15.5% +18.0% +53.5% CHAPTER 3 Income Flows versus Cash Flows of Cash Flows versus Cash Flows: Understanding the Statement Exhibit 3.32 (Continued Purchase of Company stock Dividends paid to noncontrolling interest Purchase of noncontrolling interest Other financing activities Net cash used in financing activities Effect of exchange rates on cash and cash equivalents Net increase (decrease) in cash and cash equivalents Cash and cash equivalents at beginning of year Cash and cash equivalents at end of period Supplemental disclosure of cash flow information: Income taxes paid Interest paicd (719) (16,122) (15,071) 7,781 $ 7,281 S 8,705 9,135 2,362 Source: Walmart, Form 10-K for the Fiscal Year Ended 2012 REQUIRED a. Explain why depreciation and amortization appear as an addition when net income is converted to cash flow from operations. b. For 2016, Walmart shows an adjustment for inventories of negative $703 million. How- ever, on the balance sheet, inventories declined from $45,141 million to $44,469 million, a difference of $672 million. Explain the $703 million adjustment and offer examples of why the adjustment differs from the change in the inventory balance. dkse int c. Estimate the amount of cash received from customers during 2016. d. Discuss the relation between net income and cash flow from operations for each of the three years. e. Discuss the relations among cash flows from operating, investing, and financing activities for each of the three years. CASE 3.2 Prime Contractors LO 3.2 LO 3-3,Lo Prime Contractors (Prime) is a privately owned company that contracts with the U.S. govern- r (usually five-year) contracts. ts principal serv- ment to provide various services under multiyear (usuall ices are as follows: Refuse: Picks up and disposes of refuse from military bases Shuttle: Provides parking and bases on government-sponsored research cam- Animal Care rodterinary care for animals used in research at govern- Animal Care: ment-sponsored facilities Prime Contractors Prime's sales mix for the years ending September 30, Year 6 to Year 10, is as follows: Refuse Services Shuttle Services Animal Care Services Year 6 Year 7 Year 8 Year 9 Year 10 59.9% 48.5% 20.7% 11.4% 7.1% 40.1% 31.2% 220% 26.9% 22.5% 20.3% 573% 61.7% 70.4% As the sales mix data indicate began to exit the refuse services business and ge Exhibit 3.33 presents a statement of cash flows for Prime for Years 6 through 10. , Prime engaged in a strategic shift beginning in Year 7. It ared up its animal care services business Exhibit 3.33 Prime Contractors Statement of Cash Flows Prime Contractors Statement of Cash Flows (amounts in thousands) (Case 3.2) Year 10Year 9 Year 8Year 7Year 6 OPERATIONS Net income Depreciation $ 568474 $ 47 249 261 Deferred income taxes (139)(78)(52)((38) Loss (Gain) on disposition of fixed assets Other additions and subtractions (Increase) Decrease in accounts receivable (Increase) Decrease in other current assets Increase (Decrease) in accounts payable Increase (Decrease) in other current liabilities Cash Flow from Operations INVESTING Fixed assets sold Fixed assets acquired Other investing transactions Cash Flow from Investing FINANCING (865) (263) 647) (1421) 507 612 964 288 64 (33 (310) $ 535 $146118$ (56) (911) (2,003) 168 99 (56) (849) $ (1,940) Increase (Decrease) in short-term borrowing S324 $12(127) 276 204 Increase in long-term borrowing Decrease in long-term borrowing Cash Flow from Financing Change in Cash Cash-Beginning of year Cash-End of Year Change in sales from previous year 911 1,987 (742) (1011) (658) (42 $ (634) (730)$ (930)529 S 1768 S69 $ (19) (22) (32) (108) 6S 25 4779 +53.5% 75 +15.5% +18.0% +38.5% +47.1% CHAPTER 3 Income Flows versus Cash Flows: Understanding the Statement of Cash Flows REQUIRED a. What evidence do you see in Exhibit 3.33 of Prime's strategic shift from refuse services to b. Discuss how Prime's net income could decline between Year 6 and Year 8 while its cash c. Discuss how Prime's net income could increase between Year 8 and Year 10 while its d. What is the likely reason that the adjustment for deferred income taxes when converting animal care services? flow from operations increased. cash flow from operations decreased. net income to cash flow from operations was an addition in Year 6 to Year 8 but a sub- traction in Year 9 and Year 10? income when cash flow from operations is computed. 8 to Year 10. What is the likely reason for this shift in financing? e. Explain why gains on the disposition of fixed assets appear as a subtraction from net f. Prime increased its long-term debt net in Year 6 and Year 7 but decreased it net in Year Prime Contractors 187 Prime's sales mix for the years ending September 30, Year 6 to Year 10, is as follows Refuse Services Shuttle Animal Care Services Year 8 Year 9 Year 10 59.9% 48.5% 20.7% 11.4% 7.1% 31.2% 22.0% 26,9% 22.5% 20.3% 573% 61.7% 70.4% the sales mix data indicate, Prime engaged in a strategic shift beginning in Year 7. It began to exit the refuse services business and geared up its animal care services business 3.33 presents a statement of cash flows for Prime for Years 6 through 10 Exhibit 3.33 Prime Contractors Statement of Cash Flows (amounts in thousands) Case 3.2) Year 10 Year 9Year 8 Year 7 Year 6 OPERATIONS Net income Depreciation Deferred income taxes Loss (Gain) on disposition of fixed assets Other additions and subtractions (Increase) Decrease in accounts receivable (Increase) Decrease in other current assets Increase (Decrease) in accounts payable Increase (Decrease) in other current liabilities Cash Flow from Operations INVESTING Fixed assets sold Fixed assets acquired Other investing transactions Cash Flow from Investing FINANCING $ 568 474 $ 47 $ 249 $ 261 595 (139) (110) (82) 827616 (52) (263) 2 (865) (647) (1,421) 19 (174) (310) (272) 926 (33) 423 (177) 100 507 268 64 5 535 $ 612 S 964 288 $ 146 $ 118 $ (56) (911) (2,003) $ 168 99 (56 (849) $ (1940) $ 276 $ 204 1,987 (Decrease) in short-term borrowing $ 324 12 $ (127) Increase in long-term borrowing Decrease in long-term borrowing Cash Flow from Financing Change in Cash Cash- Beginning of year Cash-End of Year Change in sales from previous year 658 (960) (742) (1,011 S(634) (730(30 $29 (19(22) (82) +38.5% +47.1% +15.5% +18.0% +53.5% CHAPTER 3 Income Flows versus Cash Flows of Cash Flows versus Cash Flows: Understanding the Statement Exhibit 3.32 (Continued Purchase of Company stock Dividends paid to noncontrolling interest Purchase of noncontrolling interest Other financing activities Net cash used in financing activities Effect of exchange rates on cash and cash equivalents Net increase (decrease) in cash and cash equivalents Cash and cash equivalents at beginning of year Cash and cash equivalents at end of period Supplemental disclosure of cash flow information: Income taxes paid Interest paicd (719) (16,122) (15,071) 7,781 $ 7,281 S 8,705 9,135 2,362 Source: Walmart, Form 10-K for the Fiscal Year Ended 2012 REQUIRED a. Explain why depreciation and amortization appear as an addition when net income is converted to cash flow from operations. b. For 2016, Walmart shows an adjustment for inventories of negative $703 million. How- ever, on the balance sheet, inventories declined from $45,141 million to $44,469 million, a difference of $672 million. Explain the $703 million adjustment and offer examples of why the adjustment differs from the change in the inventory balance. dkse int c. Estimate the amount of cash received from customers during 2016. d. Discuss the relation between net income and cash flow from operations for each of the three years. e. Discuss the relations among cash flows from operating, investing, and financing activities for each of the three years. CASE 3.2 Prime Contractors LO 3.2 LO 3-3,Lo Prime Contractors (Prime) is a privately owned company that contracts with the U.S. govern- r (usually five-year) contracts. ts principal serv- ment to provide various services under multiyear (usuall ices are as follows: Refuse: Picks up and disposes of refuse from military bases Shuttle: Provides parking and bases on government-sponsored research cam- Animal Care rodterinary care for animals used in research at govern- Animal Care: ment-sponsored facilities Prime Contractors Prime's sales mix for the years ending September 30, Year 6 to Year 10, is as follows: Refuse Services Shuttle Services Animal Care Services Year 6 Year 7 Year 8 Year 9 Year 10 59.9% 48.5% 20.7% 11.4% 7.1% 40.1% 31.2% 220% 26.9% 22.5% 20.3% 573% 61.7% 70.4% As the sales mix data indicate began to exit the refuse services business and ge Exhibit 3.33 presents a statement of cash flows for Prime for Years 6 through 10. , Prime engaged in a strategic shift beginning in Year 7. It ared up its animal care services business Exhibit 3.33 Prime Contractors Statement of Cash Flows Prime Contractors Statement of Cash Flows (amounts in thousands) (Case 3.2) Year 10Year 9 Year 8Year 7Year 6 OPERATIONS Net income Depreciation $ 568474 $ 47 249 261 Deferred income taxes (139)(78)(52)((38) Loss (Gain) on disposition of fixed assets Other additions and subtractions (Increase) Decrease in accounts receivable (Increase) Decrease in other current assets Increase (Decrease) in accounts payable Increase (Decrease) in other current liabilities Cash Flow from Operations INVESTING Fixed assets sold Fixed assets acquired Other investing transactions Cash Flow from Investing FINANCING (865) (263) 647) (1421) 507 612 964 288 64 (33 (310) $ 535 $146118$ (56) (911) (2,003) 168 99 (56) (849) $ (1,940) Increase (Decrease) in short-term borrowing S324 $12(127) 276 204 Increase in long-term borrowing Decrease in long-term borrowing Cash Flow from Financing Change in Cash Cash-Beginning of year Cash-End of Year Change in sales from previous year 911 1,987 (742) (1011) (658) (42 $ (634) (730)$ (930)529 S 1768 S69 $ (19) (22) (32) (108) 6S 25 4779 +53.5% 75 +15.5% +18.0% +38.5% +47.1%