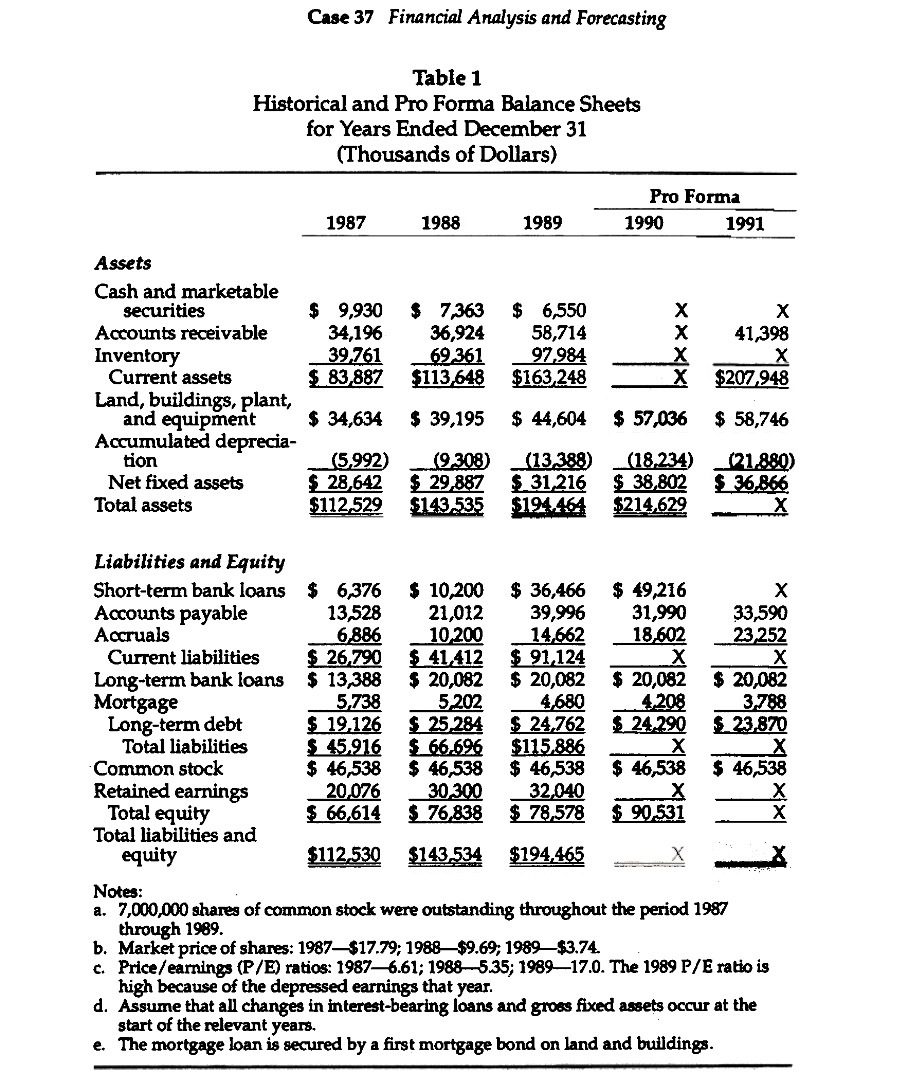
Case 37 Financial Analysis and Forecasting Table 1 Historical and Pro Forma Balance Sheets for Years Ended December 31 (Thousands of Dollars) Pro Forma 1987 1988 1989 1990 1991 Assets Cash and marketable securities $ 9,930 $ 7,363 $ 6,550 X Accounts receivable 34,196 36,924 58,714 41,398 xxxx Inventory 39,761 69,361 97,984 X Current assets $ 83,887 $113,648 $163,248 $207,948 Land, buildings, plant, and equipment $ 34,634 $ 39,195 $ 44,604 $ 57,036 $ 58,746 Accumulated deprecia- tion (5,992) (9 308) (13,388) (18,234) (21,880) Net fixed assets $ 28.642 $ 29 887 $ 31 216 $ 38,802 $ 36,866 Total assets $112,529 $143.535 $194 464 $214,629 A Liabilities and Equity Short-term bank loans $ 6,376 $ 10,200 $ 36,466 $ 49,216 X Accounts payable 13,528 21,012 39,996 31,990 33,590 Accruals 6,886 10,200 14,662 18,602 23,252 Current liabilities $ 26,790 $ 41 412 $ 91,124 X X Long-term bank loans $ 13,388 $ 20,082 $ 20,082 $ 20,082 $ 20,082 Mortgage 5,738 5,202 4,680 4208 3788 Long-term debt $ 19,126 $ 25.284 $ 24,762 $ 24.290 $ 23,870 Total liabilities $ 45,916 $ 66,696 $115,886 X X Common stock $ 46,538 $ 46,538 $ 46,538 $ 46,538 $ 46,538 Retained earnings 20.076 30 300 32,040 X Total equity $ 66,614 $ 76 838 $ 78,578 $ 90.531 Total liabilities and equity $112,530 $143,534 $194,465 Notes: a. 7,000,000 shares of common stock were outstanding throughout the period 1987 through 1989. b. Market price of shares: 1987-$17.79; 1988-$9.69; 1989-$3.74. c. Price/earnings (P/E) ratios: 1987-6.61; 1988-5.35; 1989-17.0. The 1989 P/E ratio is high because of the depressed earnings that year d. Assume that all changes in interest-bearing loans and gross fixed assets occur at the start of the relevant years. e. The mortgage loan is secured by a first mortgage bond on land and buildings