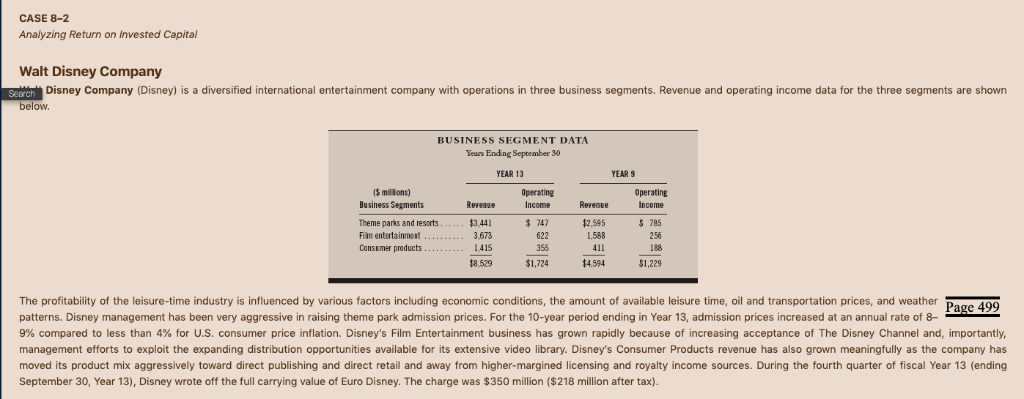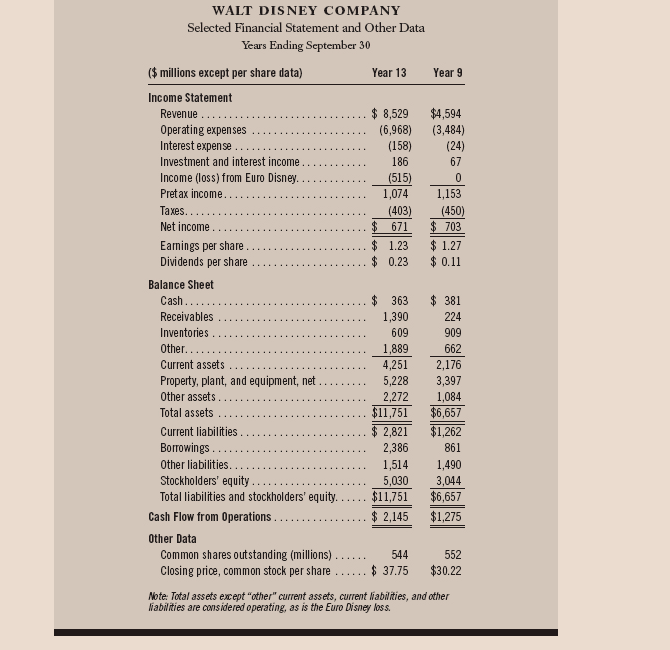


CASE 8-2 Analyzing Return on Invested Capital Walt Disney Company Search Disney Company (Disney) is a diversified international entertainment company with operations in three business segments. Revenue and operating income data for the three segments are shown below BUSINESS SEGMENT DATA Years I September 30 YEAR 13 YEAR 9 $ milions) Business Segments Operating Operating Revenue Income Revenue Income Theme parks and resorts $3.441 $747 $2,595 785 Conamer produets 1415 199 $8.529 $1,724 $4.594 $1,229 available leisure time, oil and transportation prices, and weather Dage 400 The profitability of the leisure-time industry is influenced by various factors including economic conditions, the amount patterns. Disney management has been very aggressive in raising theme park admission prices. For the 10-year period ending in Year 13, admission prices increased at an annual rate of 8- 9% compared to less than 4 % for U.S. consumer price inflation. Disney's Film Entertainment business has grown rapidly because of increasing acceptance of The Disney Channel and, importantly, management efforts to exploit the expanding distribution opportunities available for its extensive video library. Disney's Consumer Products revenue has also grown meaningfuly as the company has moved its product mix aggressively toward direct publishing and direct retail and away from higher-margined licensing and royalty income sources. During the fourth quarter of fiscal Year 13 (ending September 30, Year 13), Disney wrote off the full carry ing value of Euro Disney. The charge was $350 million ($218 million after tax). WALT DIS NEY COMPANY Selected Financial Statement and Other Data Years Ending September 30 (millions except per share data) Year 13 Year 9 Income Statement $ 8,529 $4,594 Revenue Operating expenses Interest expense (6,968) (158) (3,484) (24) Investment and interest income 186 67 Income (loss) from Euro Disney. (515) Pretax income. 1,074 1,153 Taxes (403) $ 671 $ 1.23 $ 0.23 (450) $ 703 Net income Eamings per share Dividends per share $ 1.27 $ 0.11 Balance Sheet 363 381 Cash. Receivables 1,390 224 Inventories 609 909 Other. 1,889 662 Current assets 4,251 2,176 Property, plant, and equipment, net Other assets 5,228 3,397 2,272 1,084 $6,657 $11,751 Total assets $ 2,821 $1,262 Current liabilities Borrowings Other liabilities Stockholders' equity 2,386 861 1,514 1,490 5,030 3,044 $6,657 $11,751 Total liabilities and stockholders' equity. Cash Flow from Operations $ 2,145 $1,275 Other Data Common shares outstanding (millions) Closing price, common stock per share 544 552 $37.75 $30.22 Note: Total assets except "other" current assets, current iabilities, and other Nabiities are considered operating, as is the Euro Disney loss Required: Page 500 (use year-end figures for any ratio computations a. Calculate and disaggregate Disney's return on common equity for each of the two fiscal years ending September 30, Year 9, and September 30, Year typically using averages). b. Drawing only on your answers to a and the data available, identify the two components that contributed most to the observed change in Disney's return on common equity between Year 9 and Year 13. State two reasons for the observed change in each of the two components. CHECK (a) Yr. 13 RNOA 11,82 % (b) Yr. 13 Spread 15.34 % (CFA Adapted) CASE 8-2 Analyzing Return on Invested Capital Walt Disney Company Search Disney Company (Disney) is a diversified international entertainment company with operations in three business segments. Revenue and operating income data for the three segments are shown below BUSINESS SEGMENT DATA Years I September 30 YEAR 13 YEAR 9 $ milions) Business Segments Operating Operating Revenue Income Revenue Income Theme parks and resorts $3.441 $747 $2,595 785 Conamer produets 1415 199 $8.529 $1,724 $4.594 $1,229 available leisure time, oil and transportation prices, and weather Dage 400 The profitability of the leisure-time industry is influenced by various factors including economic conditions, the amount patterns. Disney management has been very aggressive in raising theme park admission prices. For the 10-year period ending in Year 13, admission prices increased at an annual rate of 8- 9% compared to less than 4 % for U.S. consumer price inflation. Disney's Film Entertainment business has grown rapidly because of increasing acceptance of The Disney Channel and, importantly, management efforts to exploit the expanding distribution opportunities available for its extensive video library. Disney's Consumer Products revenue has also grown meaningfuly as the company has moved its product mix aggressively toward direct publishing and direct retail and away from higher-margined licensing and royalty income sources. During the fourth quarter of fiscal Year 13 (ending September 30, Year 13), Disney wrote off the full carry ing value of Euro Disney. The charge was $350 million ($218 million after tax). WALT DIS NEY COMPANY Selected Financial Statement and Other Data Years Ending September 30 (millions except per share data) Year 13 Year 9 Income Statement $ 8,529 $4,594 Revenue Operating expenses Interest expense (6,968) (158) (3,484) (24) Investment and interest income 186 67 Income (loss) from Euro Disney. (515) Pretax income. 1,074 1,153 Taxes (403) $ 671 $ 1.23 $ 0.23 (450) $ 703 Net income Eamings per share Dividends per share $ 1.27 $ 0.11 Balance Sheet 363 381 Cash. Receivables 1,390 224 Inventories 609 909 Other. 1,889 662 Current assets 4,251 2,176 Property, plant, and equipment, net Other assets 5,228 3,397 2,272 1,084 $6,657 $11,751 Total assets $ 2,821 $1,262 Current liabilities Borrowings Other liabilities Stockholders' equity 2,386 861 1,514 1,490 5,030 3,044 $6,657 $11,751 Total liabilities and stockholders' equity. Cash Flow from Operations $ 2,145 $1,275 Other Data Common shares outstanding (millions) Closing price, common stock per share 544 552 $37.75 $30.22 Note: Total assets except "other" current assets, current iabilities, and other Nabiities are considered operating, as is the Euro Disney loss Required: Page 500 (use year-end figures for any ratio computations a. Calculate and disaggregate Disney's return on common equity for each of the two fiscal years ending September 30, Year 9, and September 30, Year typically using averages). b. Drawing only on your answers to a and the data available, identify the two components that contributed most to the observed change in Disney's return on common equity between Year 9 and Year 13. State two reasons for the observed change in each of the two components. CHECK (a) Yr. 13 RNOA 11,82 % (b) Yr. 13 Spread 15.34 % (CFA Adapted)


