Case Analyzation on Managed by Q, plz answer descriptively.
1. The market they compete in?
2. Offerings like pay rates?
3. Problems with initial model?
4. Hiring process?
5. Training process?
6. Customer service beliefs?
7. How are decisions made?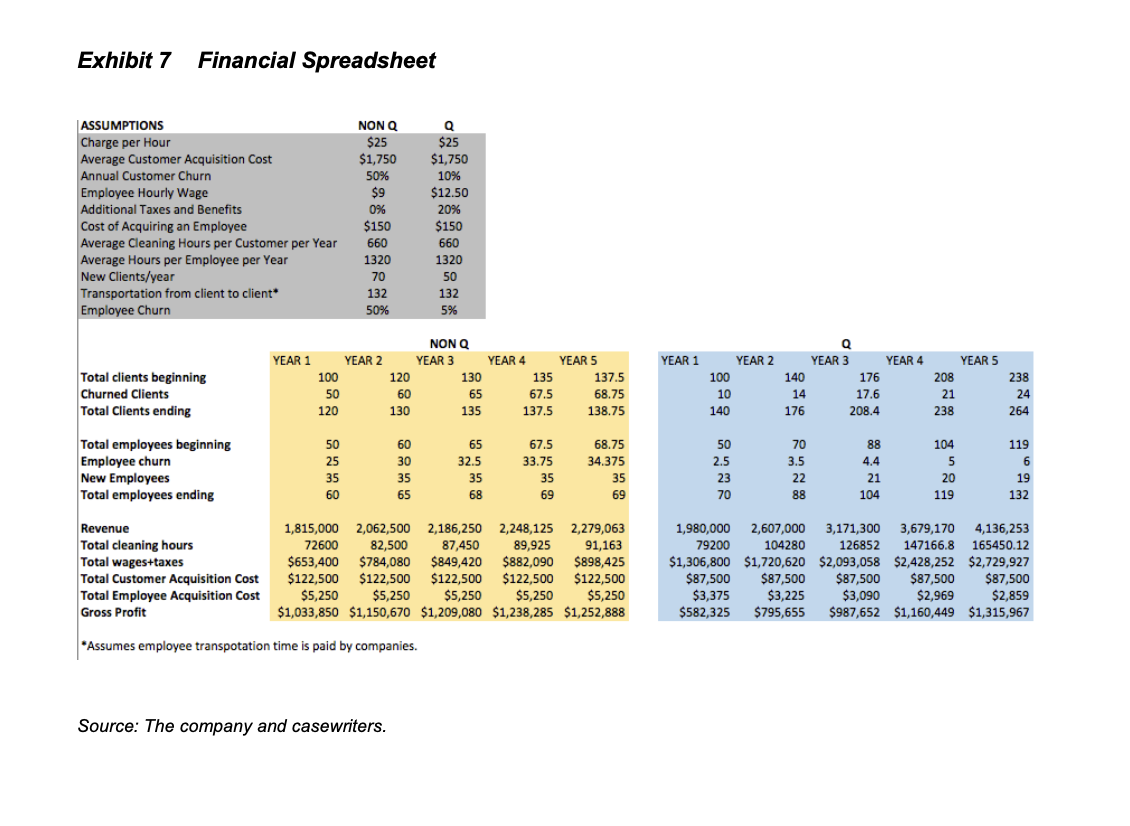
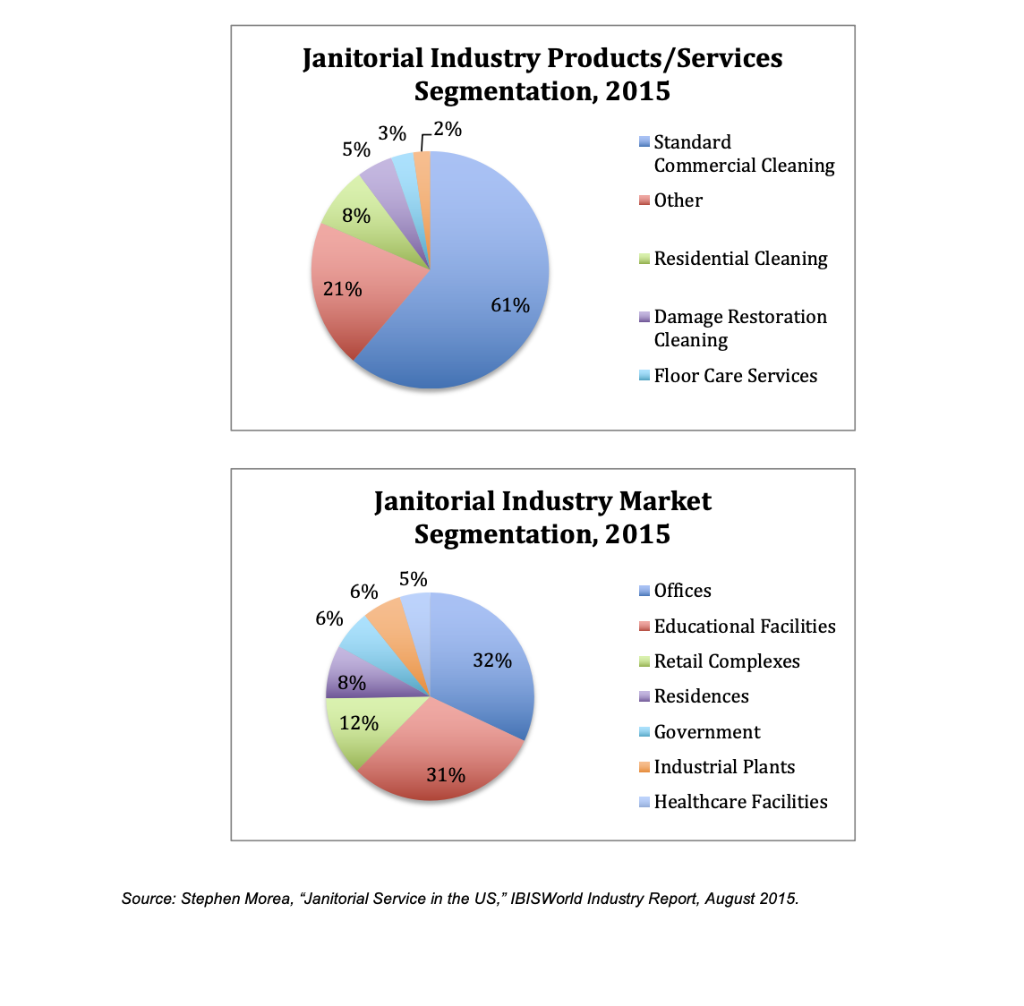
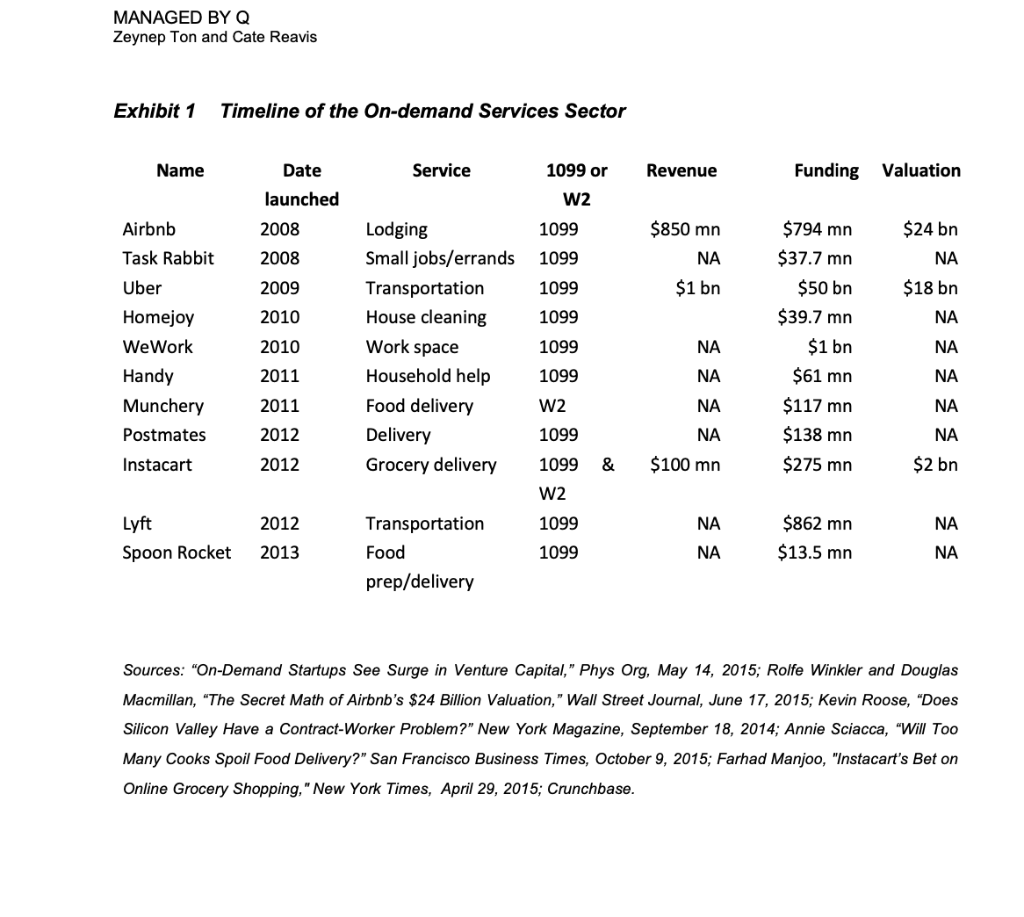
Exhibit 7 Financial Spreadsheet ASSUMPTIONS Charge per Hour Average Customer Acquisition Cost Annual Customer Churn Employee Hourly Wage Additional Taxes and Benefits Cost of Acquiring an Employee Average Cleaning Hours per Customer per Year Average Hours per Employee per Year New Clients/year Transportation from client to client Employee Churn NON Q $25 $1,750 50% $9 0% $150 660 1320 70 132 50% Q $25 $1,750 10% $12.50 20% $150 660 1320 50 132 5% 5 YEAR 1 Total clients beginning Churned Clients Total Clients ending NON Q YEAR 1 YEAR 2 YEAR 3 YEAR 4 100 120 130 135 50 60 65 67.5 120 130 135 137,5 YEAR 5 137.5 68.75 138.75 YEAR 2 100 10 140 Q YEAR 3 YEAR 4 140 176 14 17.6 176 208.4 YEAR 5 208 21 238 238 24 264 Total employees beginning Employee churn New Employees Total employees ending 50 25 35 60 60 30 35 65 65 32.5 35 68 67.5 33.75 35 69 68.75 34.375 35 69 50 2.5 23 70 70 3.5 22 88 88 4,4 21 104 104 5 20 119 119 6 19 132 Revenue Total cleaning hours Total wages+taxes Total Customer Acquisition Cost Total Employee Acquisition Cost Gross Profit 1,815,000 2,062,500 2,186,250 2,248,125 2,279,063 72600 82,500 87,450 89,925 91,163 $653,400 $784,080 $849,420 $882,090 $898,425 $122,500 $122,500 $122,500 $122,500 $122,500 $5,250 $5,250 $5,250 $5,250 $5,250 $1,033,850 $1,150,670 $1,209,080 $1,238,285 $1,252,888 1,980,000 2,607,000 3,171,300 3,679,170 4,136,253 79200 104280 126852 1471668 165450.12 $1,306,800 $1,720,620 $2,093,058 $2,428,252 $2,729,927 $87,500 $87,500 $87,500 $87,500 $87,500 $3,375 $3,225 $3,090 $2,969 $2,859 $582,325 $795,655 $987,652 $1,160,449 $1,315,967 *Assumes employee transpotation time is paid by companies. Source: The company and casewriters. Janitorial Industry Products/Services Segmentation, 2015 3% -2% 5% Standard Commercial Cleaning Other 8% Residential Cleaning 21% 61% Damage Restoration Cleaning Floor Care Services Janitorial Industry Market Segmentation, 2015 5% 6% Offices 6% Educational Facilities 32% Retail Complexes 8% Residences 12% Government 31% Industrial Plants Healthcare Facilities Source: Stephen Morea, "Janitorial Service in the US," IBISWorld Industry Report, August 2015. MANAGED BY Q Zeynep Ton and Cate Reavis Exhibit 1 Timeline of the On-demand Services Sector Name Date Service 1099 or Revenue Funding Valuation launched W2 2008 1099 $850 mn Airbnb Task Rabbit 2008 1099 NA $24 bn NA $18 bn NA Uber $1 bn 2009 2010 1099 1099 2010 Lodging Small jobs/errands Transportation House cleaning Work space Household help Food delivery Delivery Grocery delivery 1099 Homejoy We Work Handy Munchery Postmates NA $794 mn $37.7 mn $50 bn $39.7 mn $1 bn $61 mn $117 mn $138 mn $275 mn NA NA 2011 NA 1099 W2 2011 NA NA 2012 1099 NA NA Instacart 2012 1099 & $100 mn $2 bn W2 2012 1099 NA NA Lyft Spoon Rocket Transportation Food prep/delivery $862 mn $13.5 mn 2013 1099 NA NA Sources: "On-Demand Startups See Surge in Venture Capital," Phys Org, May 14, 2015; Rolfe Winkler and Douglas Macmillan, "The Secret Math of Airbnb's $24 Billion Valuation," Wall Street Journal, June 17, 2015; Kevin Roose, Does Silicon Valley Have a Contract-Worker Problem?" New York Magazine, September 18, 2014; Annie Sciacca, "Will Too Many Cooks Spoil Food Delivery?" San Francisco Business Times, October 9, 2015; Farhad Manjoo, "Instacart's Bet on Online Grocery Shopping," New York Times, April 29, 2015; Crunchbase. Customer Service Operators were encouraged to do whatever it took to deliver great service. Teran noted, We're never going to tell a customer that we're cheapest, but we will provide the best quality. I think it's a dangerous thing for a service company to start a race to the bottom. QMs were continually in communication with office managers through the iPad, phone, email, or face-to-face visits. Office managers could add tasks and could work with QMs to adjust the length of cleaning sessions. Customer feedback was crucial. As Teran explained, We talked to a lot of people who owned cleaning companies before we launched and they told us that no news is good news and that we're crazy for asking for feedback. Our belief is that no news means that our customers are in the process of finding another cleaning service. Office managers could also rate the operators after each cleaning, which they did 20% of the time. Ratings were based on checking in and out on time, completion of all tasks, and a customer's perception of the quality of the service. Senior VP of operations Armando Roman said, The rating is from one to five stars. And I can tell you for a fact that we jump through the roof if we see anything that is below five stars. As of June 2015, Q had a high customer retention rate (over 90%) and had overwhelmingly positive Yelp reviews in all three markets in which it operated. (See Exhibit 9 for a few reviews.) Q Culture Operators often used the term Q to express how to be or do something. We have a code that tells what it means to be Q," Teran explained. People will see something or someone and say either that's very Q or it's not. Being Q meant solving hard problems, because those were the ones worth solving. It meant believing that technology could help people do their jobs, but could not do their jobs for them. It also meant communicating fearlessly. The original core value of transparency was a big part of being Q. Transparency set Q apart in the janitorial and maintenance space and made it easier for the company to spot problems and continuously improve. Customers were asked to provide continual feedback on their operator and on any other Q services so that the company could keep improving. QMs were encouraged to conduct outreach to office managers to assess the health of the account and spot problems. Q employees were encouraged to communicate back to Q on what was working and what wasn't through the operator app, emails to their managers, and monthly surveys. When an operator suggested an idea to HQ, it was passed on to the appropriate process owner. Someone at HQ would get back to the operator, who would then know that he or she had been heard. Q management, in turn, shared information with its operators. The same updates I share with my board, I'll share with our operators, Teran said. Company Background Q's founders, Dan Teran and Saman Rahmanian, met at Prehype, a venture development firm, and found that they shared a fascination with design and how it could be used to create great experiences. Teran had worked in many startups and as a community organizer in Baltimore, Maryland and Rahmanian had been successful in advertising. The two also shared their dissatisfaction with the maintenance services in their housing co-ops.4 Rahmanian was on the board of his co-op and in charge of dealing with the maintenance company. The service was terrible, he explained. There was no transparency. There was a clear contract of the tasks that were supposed to be done on a daily basis but you couldn't ensure or enforce that the cleaner vacuumed the hallways and did everything that he was supposed to do on a day-to-day basis. Communication was also tough. The maintenance company was still operating in an analogue world. I had to leave voicemails. I had to fax documents to get work approved. It dawned on Teran and Rahmanian that, merging their interests in design and technology, they could develop a fully transparent way to manage a physical space, including cleaning and maintenance. They envisioned a wall-mounted iPad with a customized dashboard that would list all the tasks to be done and show customers when each task had been taken care of. The opportunity was big. The $51 billion janitorial service industry was highly fragmented. Of the nearly 860,000 janitorial services in the United States, employing 1.8 million people, 96% had fewer than five employees. Office-cleaning services accounted for 32% of the industry's revenue (see Exhibit 2). The top three companies took in 10% of the revenue. The biggest player, ABM Industries, served commercial buildings and residential complexes and offered janitorial services, parking, facility solutions, building solutions, security, and other services. Janitorial services accounted for more than 50% of its $2.7 billion Exhibit 7 Financial Spreadsheet ASSUMPTIONS Charge per Hour Average Customer Acquisition Cost Annual Customer Churn Employee Hourly Wage Additional Taxes and Benefits Cost of Acquiring an Employee Average Cleaning Hours per Customer per Year Average Hours per Employee per Year New Clients/year Transportation from client to client Employee Churn NON Q $25 $1,750 50% $9 0% $150 660 1320 70 132 50% Q $25 $1,750 10% $12.50 20% $150 660 1320 50 132 5% 5 YEAR 1 Total clients beginning Churned Clients Total Clients ending NON Q YEAR 1 YEAR 2 YEAR 3 YEAR 4 100 120 130 135 50 60 65 67.5 120 130 135 137,5 YEAR 5 137.5 68.75 138.75 YEAR 2 100 10 140 Q YEAR 3 YEAR 4 140 176 14 17.6 176 208.4 YEAR 5 208 21 238 238 24 264 Total employees beginning Employee churn New Employees Total employees ending 50 25 35 60 60 30 35 65 65 32.5 35 68 67.5 33.75 35 69 68.75 34.375 35 69 50 2.5 23 70 70 3.5 22 88 88 4,4 21 104 104 5 20 119 119 6 19 132 Revenue Total cleaning hours Total wages+taxes Total Customer Acquisition Cost Total Employee Acquisition Cost Gross Profit 1,815,000 2,062,500 2,186,250 2,248,125 2,279,063 72600 82,500 87,450 89,925 91,163 $653,400 $784,080 $849,420 $882,090 $898,425 $122,500 $122,500 $122,500 $122,500 $122,500 $5,250 $5,250 $5,250 $5,250 $5,250 $1,033,850 $1,150,670 $1,209,080 $1,238,285 $1,252,888 1,980,000 2,607,000 3,171,300 3,679,170 4,136,253 79200 104280 126852 1471668 165450.12 $1,306,800 $1,720,620 $2,093,058 $2,428,252 $2,729,927 $87,500 $87,500 $87,500 $87,500 $87,500 $3,375 $3,225 $3,090 $2,969 $2,859 $582,325 $795,655 $987,652 $1,160,449 $1,315,967 *Assumes employee transpotation time is paid by companies. Source: The company and casewriters. Janitorial Industry Products/Services Segmentation, 2015 3% -2% 5% Standard Commercial Cleaning Other 8% Residential Cleaning 21% 61% Damage Restoration Cleaning Floor Care Services Janitorial Industry Market Segmentation, 2015 5% 6% Offices 6% Educational Facilities 32% Retail Complexes 8% Residences 12% Government 31% Industrial Plants Healthcare Facilities Source: Stephen Morea, "Janitorial Service in the US," IBISWorld Industry Report, August 2015. MANAGED BY Q Zeynep Ton and Cate Reavis Exhibit 1 Timeline of the On-demand Services Sector Name Date Service 1099 or Revenue Funding Valuation launched W2 2008 1099 $850 mn Airbnb Task Rabbit 2008 1099 NA $24 bn NA $18 bn NA Uber $1 bn 2009 2010 1099 1099 2010 Lodging Small jobs/errands Transportation House cleaning Work space Household help Food delivery Delivery Grocery delivery 1099 Homejoy We Work Handy Munchery Postmates NA $794 mn $37.7 mn $50 bn $39.7 mn $1 bn $61 mn $117 mn $138 mn $275 mn NA NA 2011 NA 1099 W2 2011 NA NA 2012 1099 NA NA Instacart 2012 1099 & $100 mn $2 bn W2 2012 1099 NA NA Lyft Spoon Rocket Transportation Food prep/delivery $862 mn $13.5 mn 2013 1099 NA NA Sources: "On-Demand Startups See Surge in Venture Capital," Phys Org, May 14, 2015; Rolfe Winkler and Douglas Macmillan, "The Secret Math of Airbnb's $24 Billion Valuation," Wall Street Journal, June 17, 2015; Kevin Roose, Does Silicon Valley Have a Contract-Worker Problem?" New York Magazine, September 18, 2014; Annie Sciacca, "Will Too Many Cooks Spoil Food Delivery?" San Francisco Business Times, October 9, 2015; Farhad Manjoo, "Instacart's Bet on Online Grocery Shopping," New York Times, April 29, 2015; Crunchbase. Customer Service Operators were encouraged to do whatever it took to deliver great service. Teran noted, We're never going to tell a customer that we're cheapest, but we will provide the best quality. I think it's a dangerous thing for a service company to start a race to the bottom. QMs were continually in communication with office managers through the iPad, phone, email, or face-to-face visits. Office managers could add tasks and could work with QMs to adjust the length of cleaning sessions. Customer feedback was crucial. As Teran explained, We talked to a lot of people who owned cleaning companies before we launched and they told us that no news is good news and that we're crazy for asking for feedback. Our belief is that no news means that our customers are in the process of finding another cleaning service. Office managers could also rate the operators after each cleaning, which they did 20% of the time. Ratings were based on checking in and out on time, completion of all tasks, and a customer's perception of the quality of the service. Senior VP of operations Armando Roman said, The rating is from one to five stars. And I can tell you for a fact that we jump through the roof if we see anything that is below five stars. As of June 2015, Q had a high customer retention rate (over 90%) and had overwhelmingly positive Yelp reviews in all three markets in which it operated. (See Exhibit 9 for a few reviews.) Q Culture Operators often used the term Q to express how to be or do something. We have a code that tells what it means to be Q," Teran explained. People will see something or someone and say either that's very Q or it's not. Being Q meant solving hard problems, because those were the ones worth solving. It meant believing that technology could help people do their jobs, but could not do their jobs for them. It also meant communicating fearlessly. The original core value of transparency was a big part of being Q. Transparency set Q apart in the janitorial and maintenance space and made it easier for the company to spot problems and continuously improve. Customers were asked to provide continual feedback on their operator and on any other Q services so that the company could keep improving. QMs were encouraged to conduct outreach to office managers to assess the health of the account and spot problems. Q employees were encouraged to communicate back to Q on what was working and what wasn't through the operator app, emails to their managers, and monthly surveys. When an operator suggested an idea to HQ, it was passed on to the appropriate process owner. Someone at HQ would get back to the operator, who would then know that he or she had been heard. Q management, in turn, shared information with its operators. The same updates I share with my board, I'll share with our operators, Teran said. Company Background Q's founders, Dan Teran and Saman Rahmanian, met at Prehype, a venture development firm, and found that they shared a fascination with design and how it could be used to create great experiences. Teran had worked in many startups and as a community organizer in Baltimore, Maryland and Rahmanian had been successful in advertising. The two also shared their dissatisfaction with the maintenance services in their housing co-ops.4 Rahmanian was on the board of his co-op and in charge of dealing with the maintenance company. The service was terrible, he explained. There was no transparency. There was a clear contract of the tasks that were supposed to be done on a daily basis but you couldn't ensure or enforce that the cleaner vacuumed the hallways and did everything that he was supposed to do on a day-to-day basis. Communication was also tough. The maintenance company was still operating in an analogue world. I had to leave voicemails. I had to fax documents to get work approved. It dawned on Teran and Rahmanian that, merging their interests in design and technology, they could develop a fully transparent way to manage a physical space, including cleaning and maintenance. They envisioned a wall-mounted iPad with a customized dashboard that would list all the tasks to be done and show customers when each task had been taken care of. The opportunity was big. The $51 billion janitorial service industry was highly fragmented. Of the nearly 860,000 janitorial services in the United States, employing 1.8 million people, 96% had fewer than five employees. Office-cleaning services accounted for 32% of the industry's revenue (see Exhibit 2). The top three companies took in 10% of the revenue. The biggest player, ABM Industries, served commercial buildings and residential complexes and offered janitorial services, parking, facility solutions, building solutions, security, and other services. Janitorial services accounted for more than 50% of its $2.7 billion


