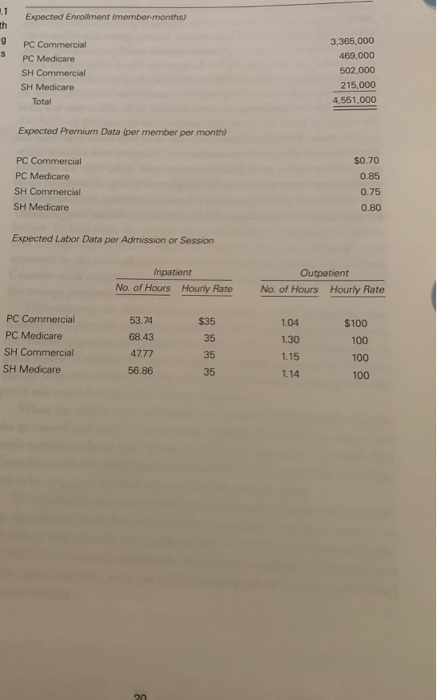
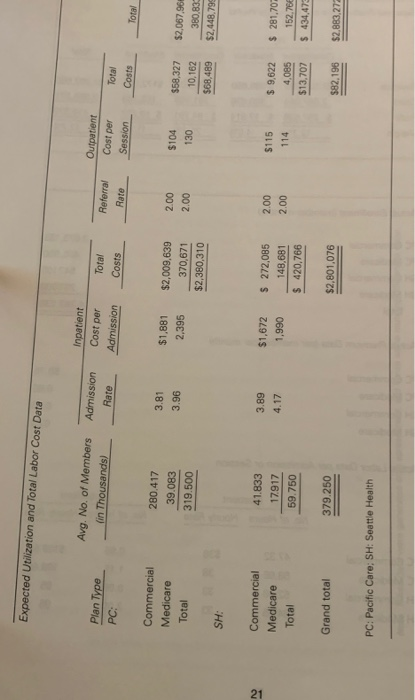
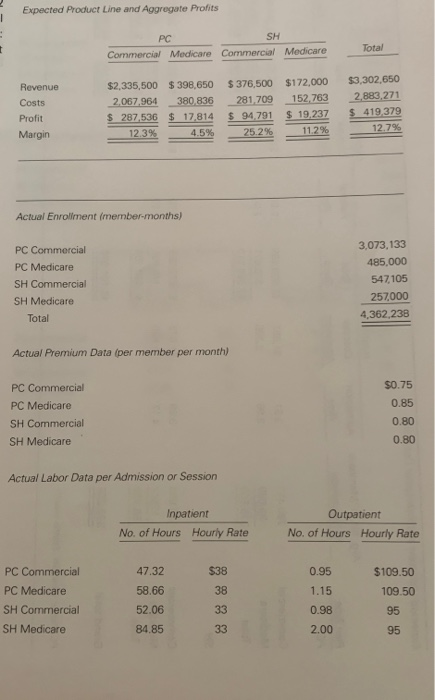
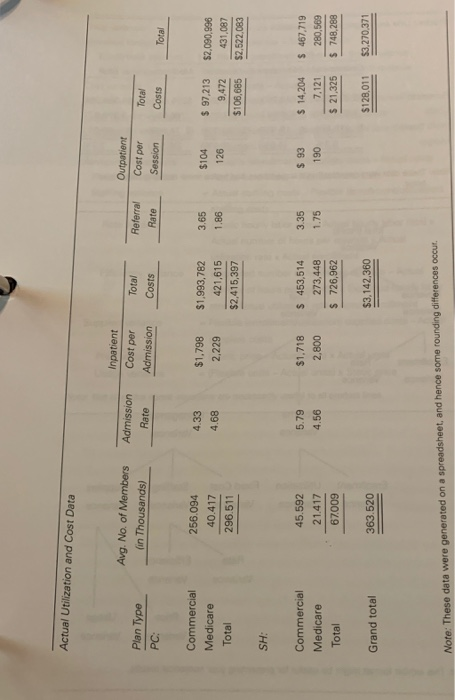
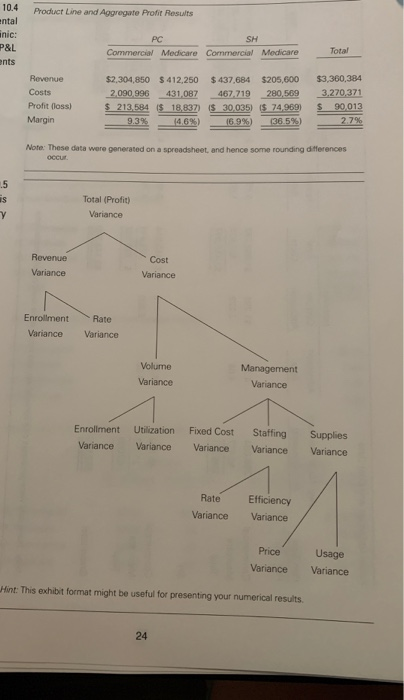
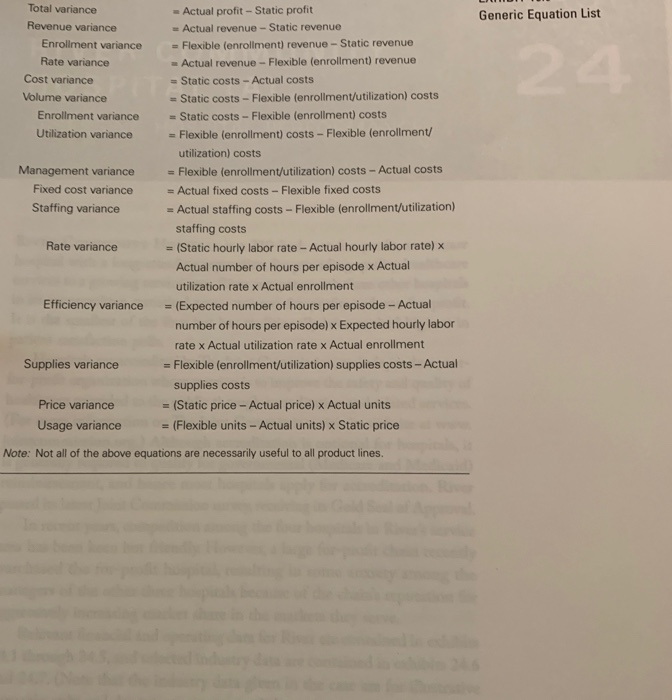
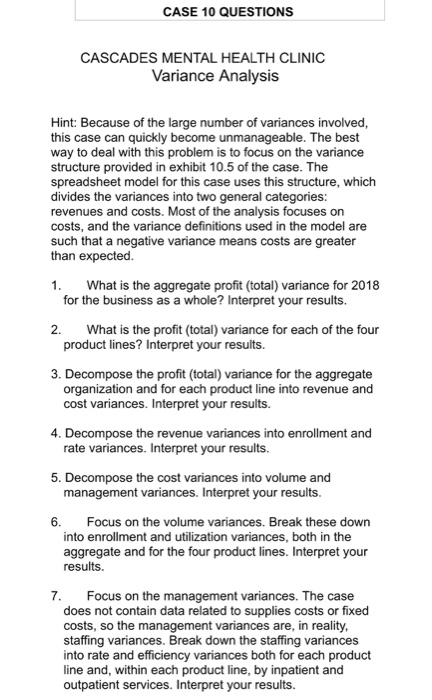
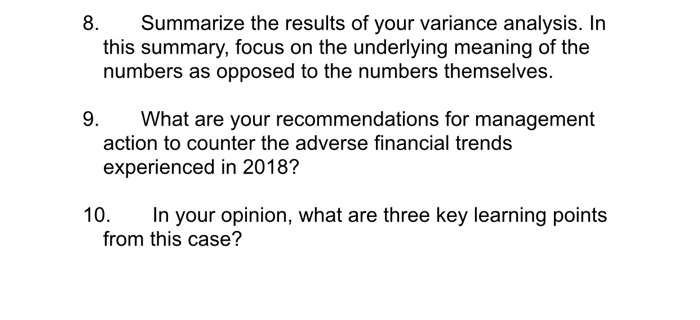
CASE CASCADES MENTAL HEALTH CLINIC VARIANCE ANALYSIS 10 CASCADES MENTAL HEALTH CLINIC is a not-for-profit, multidisciplinary mental health provider that offers both inpatient and outpatient services on a full-risk (capitated) basis to members of managed care plans. Its clinical staff consists primarily of psychiatrists, psychologists, psychiatric nurses, social workers, and chemical dependency counselors. Currently, Cascades has major contracts with two large managed care organizations in its service area: Pacific Care Plan and Seattle Health Plan. Each of these organizations has both commercial and Medicare health maintenance organization (HMO) contracts with Cascades. Thus, in total, there are four separate product lines. Cascades is partially funded by state and local governments. The agree- ment with the funding agencies is that funds received are to be used to cover overhead and capital expenses. Furthermore, expenses for drugs and other medical and administrative supplies are billed separately to the HMOs at cost. Thus, overhead and supplies expenses are not part of this budget, which means that the analysis focuses on clinical labor expenses. If the assumption is made that other payment mechanisms cover overhead, capital expenses, and supplies at cost, then the profitability of Cascades is solely a function of its ability to create revenues that exceed labor costs. Thus, its operating budget focuses on enrollment, per member premiums, utilization, and labor costs. Exhibit 10.1 lists the assumptions used to prepare Cascades's 2018 operating budget. Note that the four product lines are expected to provide a total of 4,551,000 member-months of revenue during 2018. Also, note that each product line has a different per-member per-month (PMPM) payment (Premium) amount. Exhibit 10.1 also shows expected admission (for inpatients), referral rate (for outpatients), and labor cost and utilization data for each product line. Because of the unique employment arrangements between Cascades and its clinical staff, in which the staff are paid on the basis of the number of patient service units provided, clinical labor costs are virtually all variable, and hence labor costs are not identified as fixed or variable. Exhibit 10.2 contains the forecasted 2018 budget. In essence, the data in exhibit 10.1 are used to forecast revenues and costs, both in the aggregate and by product line. Overall, Cascades expected to earn a total profit of $419,379 on the four product lines in 2018. During the first quarter of 2018, Cascades's managers noted a higher utilization rate than budgeted. To add to their concern, the monthly enroll- ment figures supplied by the contracting managed care plans were less than those budgeted. Together, these trends indicated lower revenues and higher per enrollee costs, and hence lower profits, than forecasted in exhibit 10.2. These concerns were borne out when the first-quarter profits came in under budget. To help stem the adverse trend, the managers instituted a utiliza- tion management system in which all inpatient stays were required to be approved by the medical director-a senior staff psychiatrist. In addition, Cascades made midyear changes to its commercial premiums that increased the average premiums for the year. Unfortunately, the action taken was too little, too late to save the year. Exhibit 10.3 provides operating results for 2018, and exhibit 10.4 shows the realized aggregate and product line profit and loss (P&L) statements. A quick review of exhibit 10.4 reveals that the signals conveyed by the first- quarter data were indeed correct; although 2018 ended with a profit, the profit was much less than the amount forecasted. When the results were submitted to Cascades's CEO, Jennifer Jacobs, she grimaced and said, I knew it was coming, but I did not expect the profit number to be so low." It was immediately apparent to Jennifer that Cascades could not afford similar results in 2019. She knew that something had to be done, but the best course of action was not clear. To help plan for next year, Jennifer asked Cascades's finance and account- ing department head, Rob Maldonado, to perform a variance analysis on the data to help identify the problems that led to the poor financial results for 2018. Unfortunately, Rob's area of expertise is dealing with lenders and other capital suppliers, so he passed the assignment on to you, a newly hired financial analyst. To start the analysis, you created a diagram (exhibit 10.5) to help under- stand variance analysis. (Note that this diagram is generic and has not been customized for this case.) Furthermore, you recognize that because the volume variance consists of differences in both enrollment and utilization, it is necessary to create two flexible budgets: one flexed (adjusted) for actual enrollment only, and the other flexed for both actual enrollment and actual utilization. In addition, to help with the calculations, you jotted down an equation list for calculating variances (exhibit 10.6). (Note that not all of the equations listed are necessarily applicable to this analysis.) Of course, both Jennifer and Rob are more concerned with what the numbers mean than what the numbers are. Therefore, your variance analy- sis should include a great deal of interpretation along with the numbers. Finally, because you want to use this assignment to help advance your career at Cascades, you plan to go one step further by offering recommendations for management action along with the numbers and their interpretation. Expected Enrollment member-months) PC Commercial PC Medicare SH Commercial SH Medicare Total 3,365,000 460,000 502,000 215,000 4,551,000 Expected Premium Data (per member per month PC Commercial PC Medicare SH Commercial SH Medicare $0.70 0.85 0.75 0.80 Expected Labor Data per Admission or Session Inpatient No. of Hours Hourly Rate Outpatient No. of Hours Hourly Rate 1.04 PC Commercial PC Medicare SH Commercial SH Medicare 53.74 68.43 47.77 56.86 $100 100 1.30 1.15 Expected Utilization and Total Labor Cost Data Inpatient Plan Type PC: Avg. No. of Members (in Thousands) Admission Rate Cost per Admission Total Costs Referral Rate Outpatient Cost per Session Total Costs Total Commercial Medicare Total 280.417 39.083 319.500 3.81 3.96 $1,881 2.395 $2,009,639 370,671 $2,380,310 2.00 2.00 $104 130 $58,327 10,162 568,489 $2,067,96 380,830 $2,448.799 SH: Commercial Medicare Total 41.833 17.917 59.750 3.89 4.17 $1,672 1,990 $ 272,085 148,681 $ 420,766 2.00 2.00 $115 114 $ 9,622 4,085 $13,707 $ 281,70 152,76 $ 434,473 Grand total 379.250 $2,801,076 $82,196 $2,883,272 PC: Pacific Care; SH: Seattle Health Expected Product Line and Aggregate Profits PC Commercial Medicare Commercial Medicare Total Revenue Costs Profit Margin $2,335,500 2,067 964 $ 287 536 12.3% $398,650 380,836 $ 17,814 4.5% $376,500 281 709 $ 94.791 25.2% $172,000 152.763 $ 19,237 11.2% $3,302,650 2.883,271 $ 419.379 Actual Enrollment member-months) PC Commercial PC Medicare SH Commercial SH Medicare Total 3,073,133 485,000 547105 257,000 4,362,238 Actual Premium Data (per member per month) PC Commercial PC Medicare SH Commercial SH Medicare $0.75 0.85 0.80 Actual Labor Data per Admission or Session Inpatient No. of Hours Hourly Rate Outpatient No. of Hours Hourly Rate $38 $109.50 109.50 PC Commercial PC Medicare SH Commercial SH Medicare 47.32 58.66 52.06 84.85 0.95 1.15 0.98 2.00 Expected Product Line and Aggregate Profits PC Commercial Medicare Commercial Medicare Total Revenue Costs Profit Margin $2,335,500 2,067 964 $ 287 536 12.3% $398,650 380,836 $ 17,814 4.5% $376,500 281 709 $ 94.791 25.2% $172,000 152.763 $ 19,237 11.2% $3,302,650 2.883,271 $ 419.379 Actual Enrollment member-months) PC Commercial PC Medicare SH Commercial SH Medicare Total 3,073,133 485,000 547105 257,000 4,362,238 Actual Premium Data (per member per month) PC Commercial PC Medicare SH Commercial SH Medicare $0.75 0.85 0.80 Actual Labor Data per Admission or Session Inpatient No. of Hours Hourly Rate Outpatient No. of Hours Hourly Rate $38 $109.50 109.50 PC Commercial PC Medicare SH Commercial SH Medicare 47.32 58.66 52.06 84.85 0.95 1.15 0.98 2.00 Actual Utilization and Cost Data Avg. No. of Members fin Thousands) Admission Inpatient Cost per Admission Plan Type PC: Total Rate Outpatient Cost per Session Referral Rate Costs Total Costs Total Commercial Medicare Total 256.094 40.417 296.511 4.33 4.68 $1,798 2,229 $1,993,782 421,615 $2,415,397 3.65 1.86 $104 126 $ 97,213 9,472 $106,685 $2,090,996 431,087 $2,522,083 SH: 5.79 Commercial Medicare Total 45.592 21417 67.009 $1.718 2,800 453,514 273,448 $ 726,962 3.35 1.75 $ 93 190 456 $ 14,204 7.121 $ 21,325 $ 467,719 280,569 $ 748,288 363.520 Grand total $128,011 $3,142,360 53.270,371 Note: These data were generated on a spreadsheet, and hence some rounding differences occut 10.4 Product Line and Aggregate Profit Results Product Line ental inic: PC SH Commercial Medicare Commercial Medicare P&L ents Total Revenue Costs Profit (loss) Margin $2,304,850 $412,250 2.090 996 431.087 $ 213,584 $ 18,837 9.3% 14.69 $437,684 467.719 $ 30,035 -16.9%) $205,000 $3,360,384 280,569 3.270.371 $ 74,969) S 90,013 2.7% 138.596) Note: These data were generated on a spreadsheet and hence some rounding differences OCCU win Total (Profit) Variance Cost Revenue Variance Variance Enrollment Variance Rate Variance Volume Variance Management Variance Enrollment Variance Utilization Variance Fixed Cost Variance Staffing Variance Supplies Variance Rate Variance Efficiency Variance Price Variance Usage Variance Hint: This exhibit format might be useful for presenting your numerical results 24 Generic Equation List Total variance Revenue variance Enrollment variance Rate variance Cost variance Volume variance Enrollment variance Utilization variance Management variance Fixed cost variance Staffing variance -Actual profit - Static profit Actual revenue-Static revenue = Flexible (enrollment) revenue-Static revenue = Actual revenue - Flexible (enrollment) revenue = Static costs - Actual costs - Static costs - Flexible (enrollment/utilization) costs = Static costs - Flexible (enrollment) costs Flexible (enrollment) costs - Flexible (enrollment/ utilization) costs = Flexible (enrollment/utilization) costs - Actual costs = Actual fixed costs - Flexible fixed costs = Actual staffing costs - Flexible (enrollment/utilization) staffing costs = (Static hourly labor rate - Actual hourly labor rate) X Actual number of hours per episode x Actual utilization rate x Actual enrollment = (Expected number of hours per episode - Actual number of hours per episode) Expected hourly labor rate x Actual utilization rate x Actual enrollment - Flexible (enrollment/utilization) supplies costs - Actual supplies costs = (Static price - Actual price) Actual units = (Flexible units - Actual units) x Static price Rate variance Efficiency variance Supplies variance Price variance Usage variance Note: Not all of the above equations are necessarily useful to all product lines. CASE 10 QUESTIONS CASCADES MENTAL HEALTH CLINIC Variance Analysis Hint: Because of the large number of variances involved, this case can quickly become unmanageable. The best way to deal with this problem is to focus on the variance structure provided in exhibit 10.5 of the case. The spreadsheet model for this case uses this structure, which divides the variances into two general categories: revenues and costs. Most of the analysis focuses on costs, and the variance definitions used in the model are such that a negative variance means costs are greater than expected. 1. What is the aggregate profit (total) variance for 2018 for the business as a whole? Interpret your results. 2. What is the profit (total) variance for each of the four product lines? Interpret your results. 3. Decompose the profit (total) variance for the aggregate organization and for each product line into revenue and cost variances. Interpret your results. 4. Decompose the revenue variances into enrollment and rate variances. Interpret your results. 5. Decompose the cost variances into volume and management variances. Interpret your results. 6. Focus on the volume variances. Break these down into enrollment and utilization variances, both in the aggregate and for the four product lines. Interpret your results. 7. Focus on the management variances. The case does not contain data related to supplies costs or fixed costs, so the management variances are, in reality, staffing variances. Break down the staffing variances into rate and efficiency variances both for each product line and, within each product line, by inpatient and outpatient services. Interpret your results. 8. Summarize the results of your variance analysis. In this summary, focus on the underlying meaning of the numbers as opposed to the numbers themselves. 9. What are your recommendations for management action to counter the adverse financial trends experienced in 2018? 10. In your opinion, what are three key learning points from this case? CASE CASCADES MENTAL HEALTH CLINIC VARIANCE ANALYSIS 10 CASCADES MENTAL HEALTH CLINIC is a not-for-profit, multidisciplinary mental health provider that offers both inpatient and outpatient services on a full-risk (capitated) basis to members of managed care plans. Its clinical staff consists primarily of psychiatrists, psychologists, psychiatric nurses, social workers, and chemical dependency counselors. Currently, Cascades has major contracts with two large managed care organizations in its service area: Pacific Care Plan and Seattle Health Plan. Each of these organizations has both commercial and Medicare health maintenance organization (HMO) contracts with Cascades. Thus, in total, there are four separate product lines. Cascades is partially funded by state and local governments. The agree- ment with the funding agencies is that funds received are to be used to cover overhead and capital expenses. Furthermore, expenses for drugs and other medical and administrative supplies are billed separately to the HMOs at cost. Thus, overhead and supplies expenses are not part of this budget, which means that the analysis focuses on clinical labor expenses. If the assumption is made that other payment mechanisms cover overhead, capital expenses, and supplies at cost, then the profitability of Cascades is solely a function of its ability to create revenues that exceed labor costs. Thus, its operating budget focuses on enrollment, per member premiums, utilization, and labor costs. Exhibit 10.1 lists the assumptions used to prepare Cascades's 2018 operating budget. Note that the four product lines are expected to provide a total of 4,551,000 member-months of revenue during 2018. Also, note that each product line has a different per-member per-month (PMPM) payment (Premium) amount. Exhibit 10.1 also shows expected admission (for inpatients), referral rate (for outpatients), and labor cost and utilization data for each product line. Because of the unique employment arrangements between Cascades and its clinical staff, in which the staff are paid on the basis of the number of patient service units provided, clinical labor costs are virtually all variable, and hence labor costs are not identified as fixed or variable. Exhibit 10.2 contains the forecasted 2018 budget. In essence, the data in exhibit 10.1 are used to forecast revenues and costs, both in the aggregate and by product line. Overall, Cascades expected to earn a total profit of $419,379 on the four product lines in 2018. During the first quarter of 2018, Cascades's managers noted a higher utilization rate than budgeted. To add to their concern, the monthly enroll- ment figures supplied by the contracting managed care plans were less than those budgeted. Together, these trends indicated lower revenues and higher per enrollee costs, and hence lower profits, than forecasted in exhibit 10.2. These concerns were borne out when the first-quarter profits came in under budget. To help stem the adverse trend, the managers instituted a utiliza- tion management system in which all inpatient stays were required to be approved by the medical director-a senior staff psychiatrist. In addition, Cascades made midyear changes to its commercial premiums that increased the average premiums for the year. Unfortunately, the action taken was too little, too late to save the year. Exhibit 10.3 provides operating results for 2018, and exhibit 10.4 shows the realized aggregate and product line profit and loss (P&L) statements. A quick review of exhibit 10.4 reveals that the signals conveyed by the first- quarter data were indeed correct; although 2018 ended with a profit, the profit was much less than the amount forecasted. When the results were submitted to Cascades's CEO, Jennifer Jacobs, she grimaced and said, I knew it was coming, but I did not expect the profit number to be so low." It was immediately apparent to Jennifer that Cascades could not afford similar results in 2019. She knew that something had to be done, but the best course of action was not clear. To help plan for next year, Jennifer asked Cascades's finance and account- ing department head, Rob Maldonado, to perform a variance analysis on the data to help identify the problems that led to the poor financial results for 2018. Unfortunately, Rob's area of expertise is dealing with lenders and other capital suppliers, so he passed the assignment on to you, a newly hired financial analyst. To start the analysis, you created a diagram (exhibit 10.5) to help under- stand variance analysis. (Note that this diagram is generic and has not been customized for this case.) Furthermore, you recognize that because the volume variance consists of differences in both enrollment and utilization, it is necessary to create two flexible budgets: one flexed (adjusted) for actual enrollment only, and the other flexed for both actual enrollment and actual utilization. In addition, to help with the calculations, you jotted down an equation list for calculating variances (exhibit 10.6). (Note that not all of the equations listed are necessarily applicable to this analysis.) Of course, both Jennifer and Rob are more concerned with what the numbers mean than what the numbers are. Therefore, your variance analy- sis should include a great deal of interpretation along with the numbers. Finally, because you want to use this assignment to help advance your career at Cascades, you plan to go one step further by offering recommendations for management action along with the numbers and their interpretation. Expected Enrollment member-months) PC Commercial PC Medicare SH Commercial SH Medicare Total 3,365,000 460,000 502,000 215,000 4,551,000 Expected Premium Data (per member per month PC Commercial PC Medicare SH Commercial SH Medicare $0.70 0.85 0.75 0.80 Expected Labor Data per Admission or Session Inpatient No. of Hours Hourly Rate Outpatient No. of Hours Hourly Rate 1.04 PC Commercial PC Medicare SH Commercial SH Medicare 53.74 68.43 47.77 56.86 $100 100 1.30 1.15 Expected Utilization and Total Labor Cost Data Inpatient Plan Type PC: Avg. No. of Members (in Thousands) Admission Rate Cost per Admission Total Costs Referral Rate Outpatient Cost per Session Total Costs Total Commercial Medicare Total 280.417 39.083 319.500 3.81 3.96 $1,881 2.395 $2,009,639 370,671 $2,380,310 2.00 2.00 $104 130 $58,327 10,162 568,489 $2,067,96 380,830 $2,448.799 SH: Commercial Medicare Total 41.833 17.917 59.750 3.89 4.17 $1,672 1,990 $ 272,085 148,681 $ 420,766 2.00 2.00 $115 114 $ 9,622 4,085 $13,707 $ 281,70 152,76 $ 434,473 Grand total 379.250 $2,801,076 $82,196 $2,883,272 PC: Pacific Care; SH: Seattle Health Expected Product Line and Aggregate Profits PC Commercial Medicare Commercial Medicare Total Revenue Costs Profit Margin $2,335,500 2,067 964 $ 287 536 12.3% $398,650 380,836 $ 17,814 4.5% $376,500 281 709 $ 94.791 25.2% $172,000 152.763 $ 19,237 11.2% $3,302,650 2.883,271 $ 419.379 Actual Enrollment member-months) PC Commercial PC Medicare SH Commercial SH Medicare Total 3,073,133 485,000 547105 257,000 4,362,238 Actual Premium Data (per member per month) PC Commercial PC Medicare SH Commercial SH Medicare $0.75 0.85 0.80 Actual Labor Data per Admission or Session Inpatient No. of Hours Hourly Rate Outpatient No. of Hours Hourly Rate $38 $109.50 109.50 PC Commercial PC Medicare SH Commercial SH Medicare 47.32 58.66 52.06 84.85 0.95 1.15 0.98 2.00 Expected Product Line and Aggregate Profits PC Commercial Medicare Commercial Medicare Total Revenue Costs Profit Margin $2,335,500 2,067 964 $ 287 536 12.3% $398,650 380,836 $ 17,814 4.5% $376,500 281 709 $ 94.791 25.2% $172,000 152.763 $ 19,237 11.2% $3,302,650 2.883,271 $ 419.379 Actual Enrollment member-months) PC Commercial PC Medicare SH Commercial SH Medicare Total 3,073,133 485,000 547105 257,000 4,362,238 Actual Premium Data (per member per month) PC Commercial PC Medicare SH Commercial SH Medicare $0.75 0.85 0.80 Actual Labor Data per Admission or Session Inpatient No. of Hours Hourly Rate Outpatient No. of Hours Hourly Rate $38 $109.50 109.50 PC Commercial PC Medicare SH Commercial SH Medicare 47.32 58.66 52.06 84.85 0.95 1.15 0.98 2.00 Actual Utilization and Cost Data Avg. No. of Members fin Thousands) Admission Inpatient Cost per Admission Plan Type PC: Total Rate Outpatient Cost per Session Referral Rate Costs Total Costs Total Commercial Medicare Total 256.094 40.417 296.511 4.33 4.68 $1,798 2,229 $1,993,782 421,615 $2,415,397 3.65 1.86 $104 126 $ 97,213 9,472 $106,685 $2,090,996 431,087 $2,522,083 SH: 5.79 Commercial Medicare Total 45.592 21417 67.009 $1.718 2,800 453,514 273,448 $ 726,962 3.35 1.75 $ 93 190 456 $ 14,204 7.121 $ 21,325 $ 467,719 280,569 $ 748,288 363.520 Grand total $128,011 $3,142,360 53.270,371 Note: These data were generated on a spreadsheet, and hence some rounding differences occut 10.4 Product Line and Aggregate Profit Results Product Line ental inic: PC SH Commercial Medicare Commercial Medicare P&L ents Total Revenue Costs Profit (loss) Margin $2,304,850 $412,250 2.090 996 431.087 $ 213,584 $ 18,837 9.3% 14.69 $437,684 467.719 $ 30,035 -16.9%) $205,000 $3,360,384 280,569 3.270.371 $ 74,969) S 90,013 2.7% 138.596) Note: These data were generated on a spreadsheet and hence some rounding differences OCCU win Total (Profit) Variance Cost Revenue Variance Variance Enrollment Variance Rate Variance Volume Variance Management Variance Enrollment Variance Utilization Variance Fixed Cost Variance Staffing Variance Supplies Variance Rate Variance Efficiency Variance Price Variance Usage Variance Hint: This exhibit format might be useful for presenting your numerical results 24 Generic Equation List Total variance Revenue variance Enrollment variance Rate variance Cost variance Volume variance Enrollment variance Utilization variance Management variance Fixed cost variance Staffing variance -Actual profit - Static profit Actual revenue-Static revenue = Flexible (enrollment) revenue-Static revenue = Actual revenue - Flexible (enrollment) revenue = Static costs - Actual costs - Static costs - Flexible (enrollment/utilization) costs = Static costs - Flexible (enrollment) costs Flexible (enrollment) costs - Flexible (enrollment/ utilization) costs = Flexible (enrollment/utilization) costs - Actual costs = Actual fixed costs - Flexible fixed costs = Actual staffing costs - Flexible (enrollment/utilization) staffing costs = (Static hourly labor rate - Actual hourly labor rate) X Actual number of hours per episode x Actual utilization rate x Actual enrollment = (Expected number of hours per episode - Actual number of hours per episode) Expected hourly labor rate x Actual utilization rate x Actual enrollment - Flexible (enrollment/utilization) supplies costs - Actual supplies costs = (Static price - Actual price) Actual units = (Flexible units - Actual units) x Static price Rate variance Efficiency variance Supplies variance Price variance Usage variance Note: Not all of the above equations are necessarily useful to all product lines. CASE 10 QUESTIONS CASCADES MENTAL HEALTH CLINIC Variance Analysis Hint: Because of the large number of variances involved, this case can quickly become unmanageable. The best way to deal with this problem is to focus on the variance structure provided in exhibit 10.5 of the case. The spreadsheet model for this case uses this structure, which divides the variances into two general categories: revenues and costs. Most of the analysis focuses on costs, and the variance definitions used in the model are such that a negative variance means costs are greater than expected. 1. What is the aggregate profit (total) variance for 2018 for the business as a whole? Interpret your results. 2. What is the profit (total) variance for each of the four product lines? Interpret your results. 3. Decompose the profit (total) variance for the aggregate organization and for each product line into revenue and cost variances. Interpret your results. 4. Decompose the revenue variances into enrollment and rate variances. Interpret your results. 5. Decompose the cost variances into volume and management variances. Interpret your results. 6. Focus on the volume variances. Break these down into enrollment and utilization variances, both in the aggregate and for the four product lines. Interpret your results. 7. Focus on the management variances. The case does not contain data related to supplies costs or fixed costs, so the management variances are, in reality, staffing variances. Break down the staffing variances into rate and efficiency variances both for each product line and, within each product line, by inpatient and outpatient services. Interpret your results. 8. Summarize the results of your variance analysis. In this summary, focus on the underlying meaning of the numbers as opposed to the numbers themselves. 9. What are your recommendations for management action to counter the adverse financial trends experienced in 2018? 10. In your opinion, what are three key learning points from this case