Case: OldTown Berhad
After reading the case and doing the three-part analysis requested below, be able to explain why would or would not recommend accepting RM 3.18 per share.
1. Approach 1: Projecting Expected Future Net Cash Flows.
a. What growth rates, discount rate and terminal values are appropriate here if the Capital Asset Pricing Model is used? Growth rate of what? What information is available? Is this estimate for a shorter planning period? Or, for a terminal value estimation?
b. What value should be put on each share? Are there any difficulties of estimation?
2. Approach 2: Projecting Future Expected Dividends.
a. Estimate the cost of equity and the share value using the Gordon Growth Model of discounting future dividends.
b. How do the estimates of future growth rates of dividends affect the share valuation estimates?
3. Approach 3: Implied Growth Rates for Earnings, EBITDA or Dividends
a. Look at the multiples shown in Exhibit 6. What are the implied growth rates for target companies' EBITDA? Earnings? Revenues?
b. What can be learnt from this data?
c. Would this change the valuation placed on each share?
4. If there are valuation differences in the answers above, how to reconcile what has been found? How best to deal with the fact that both "the growth rate" and "the discount rate" are estimates? How best to structure a credible valuation model?
5. Does the offered acquisition premium affect the answer?
6. Should accepting RM 3.18 per share be recommended or not? 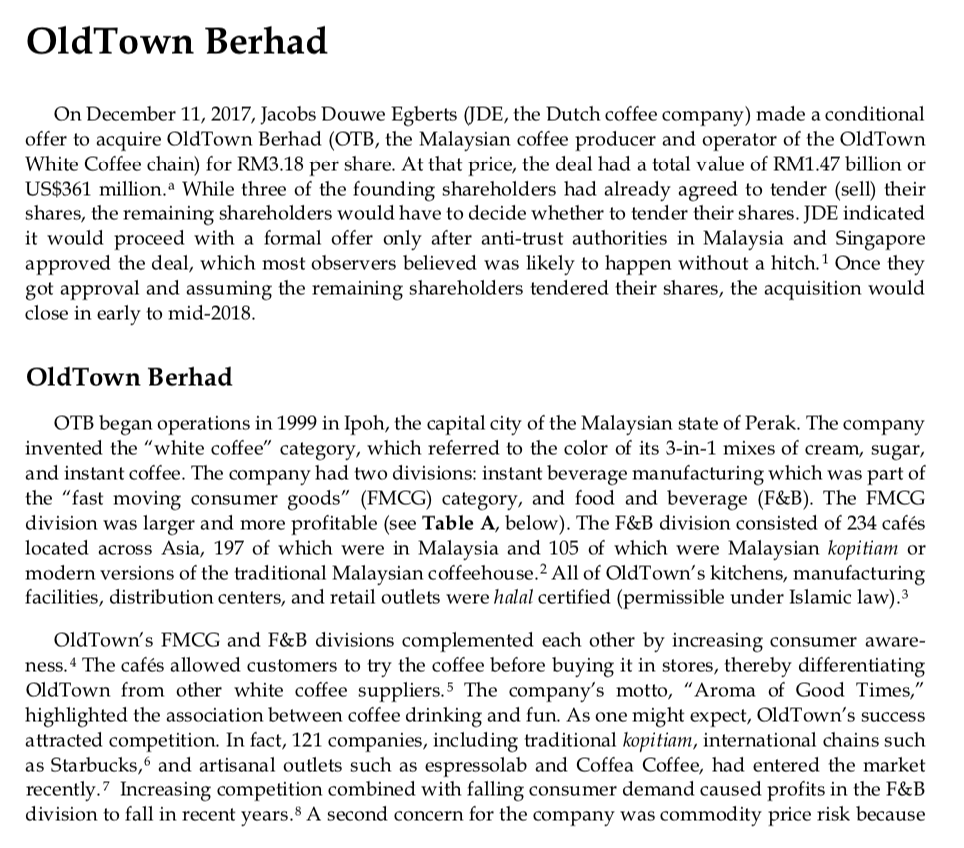
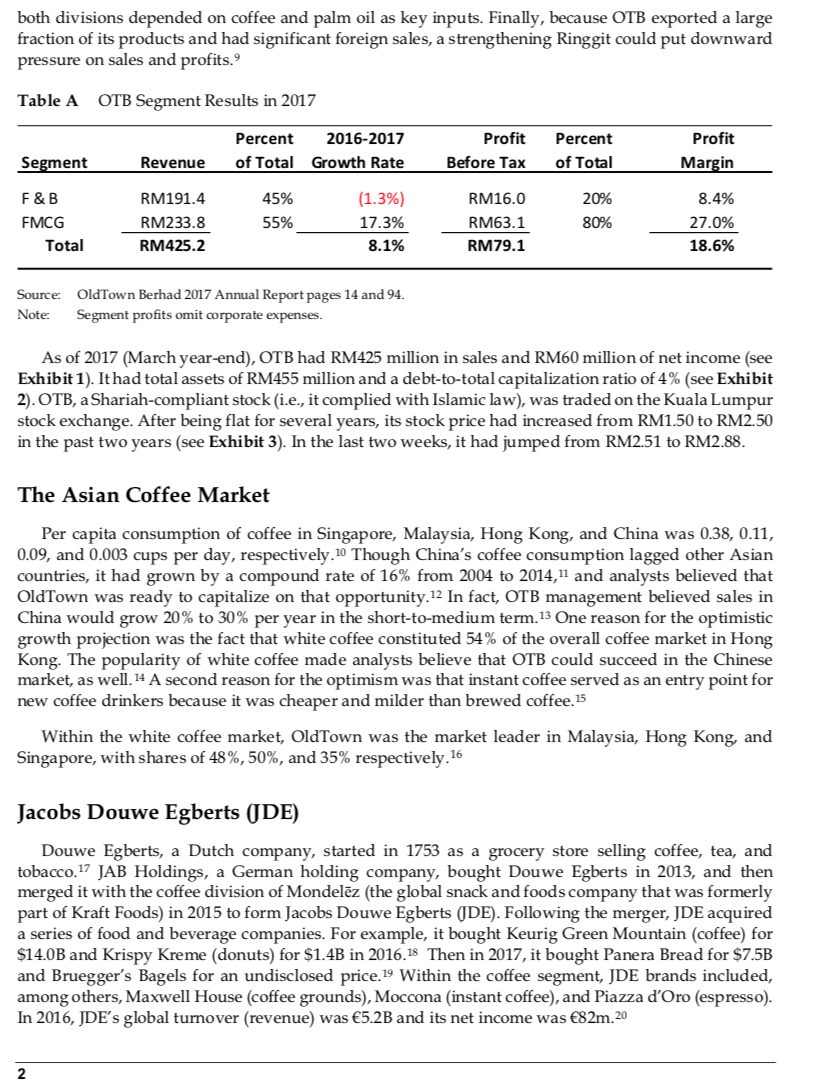
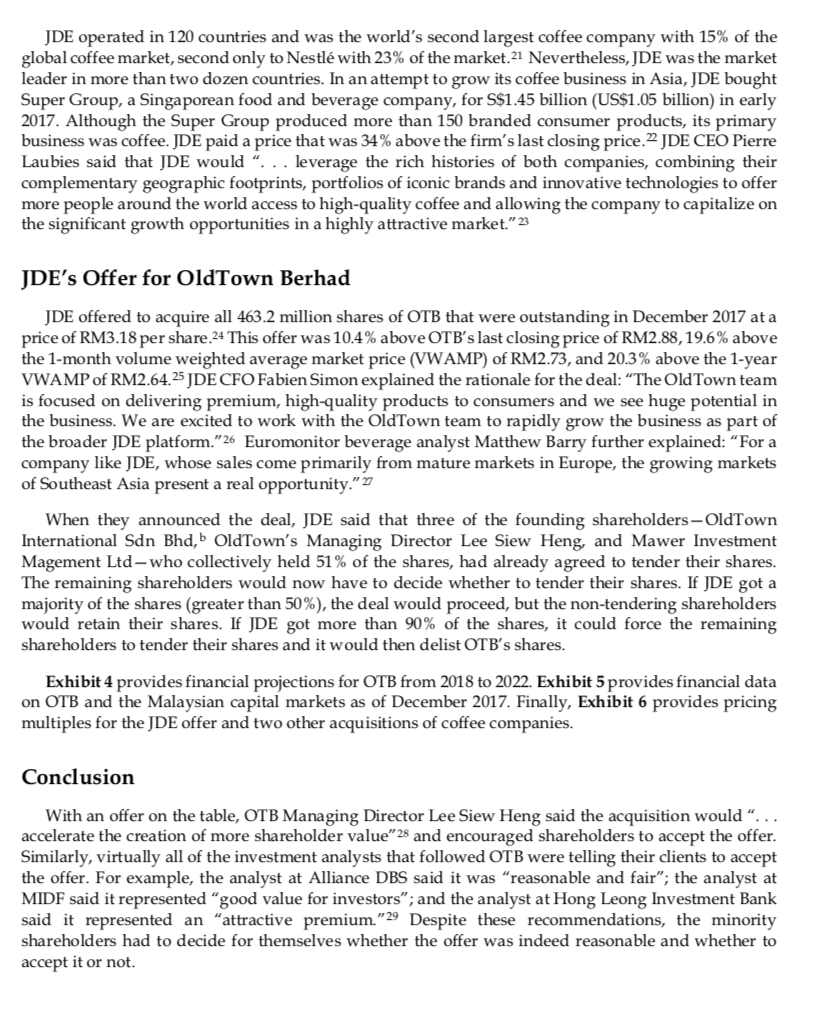
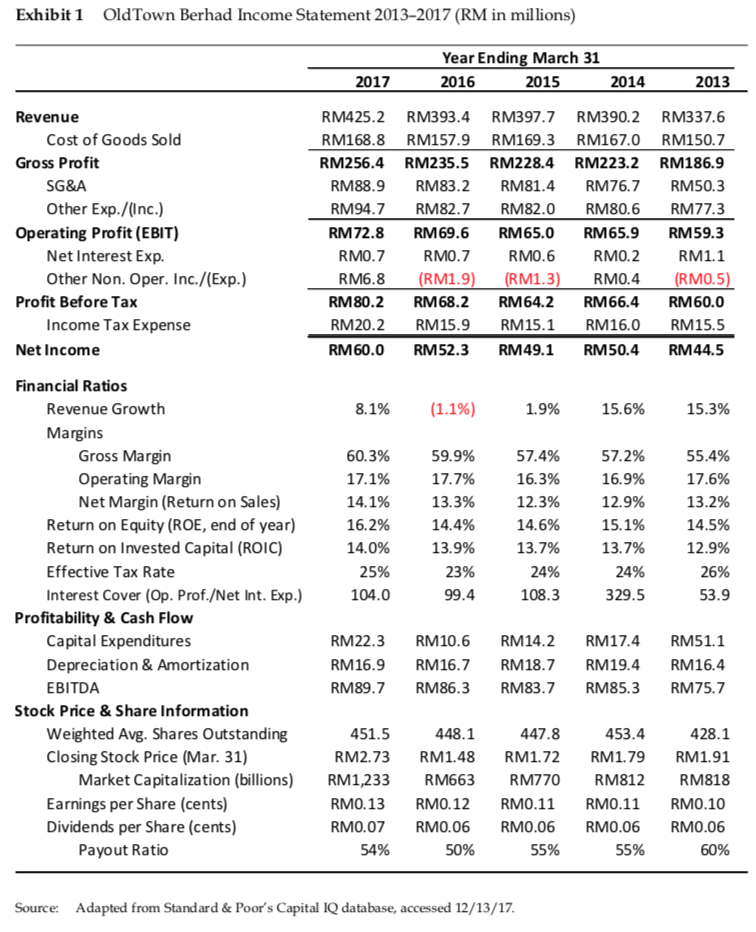
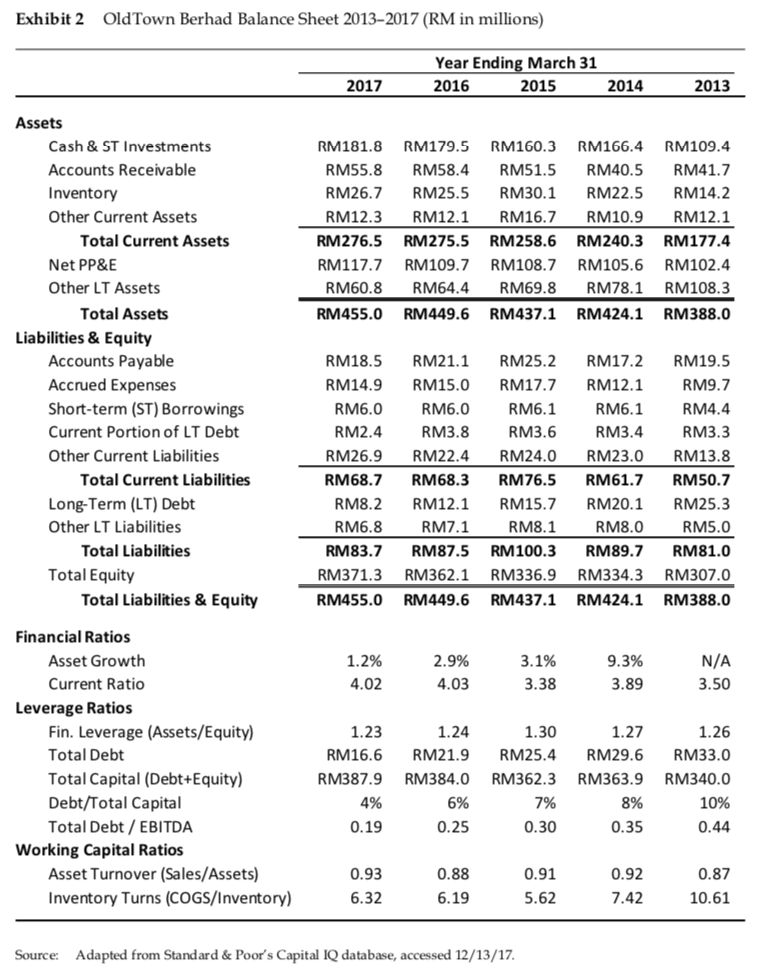
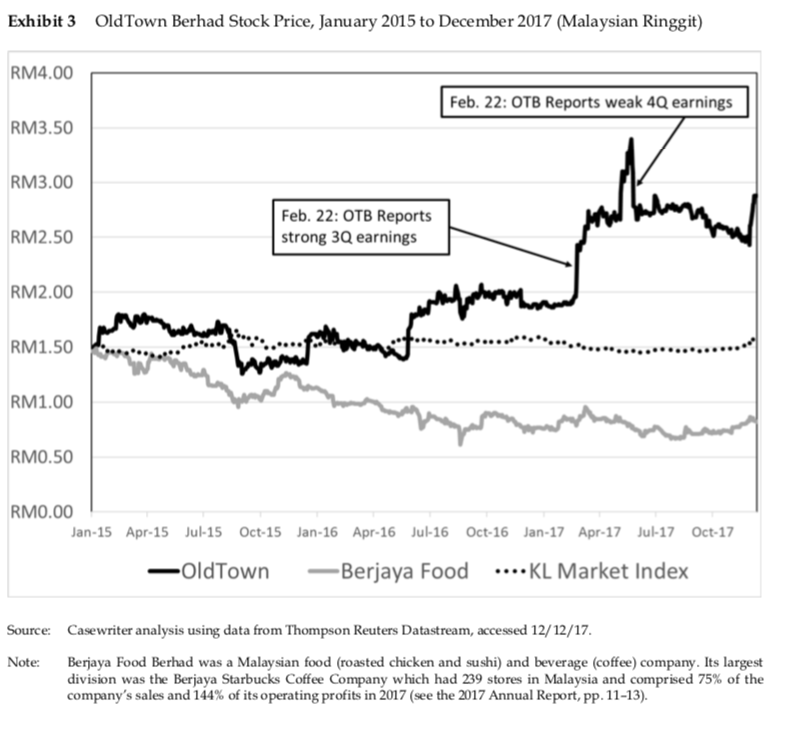
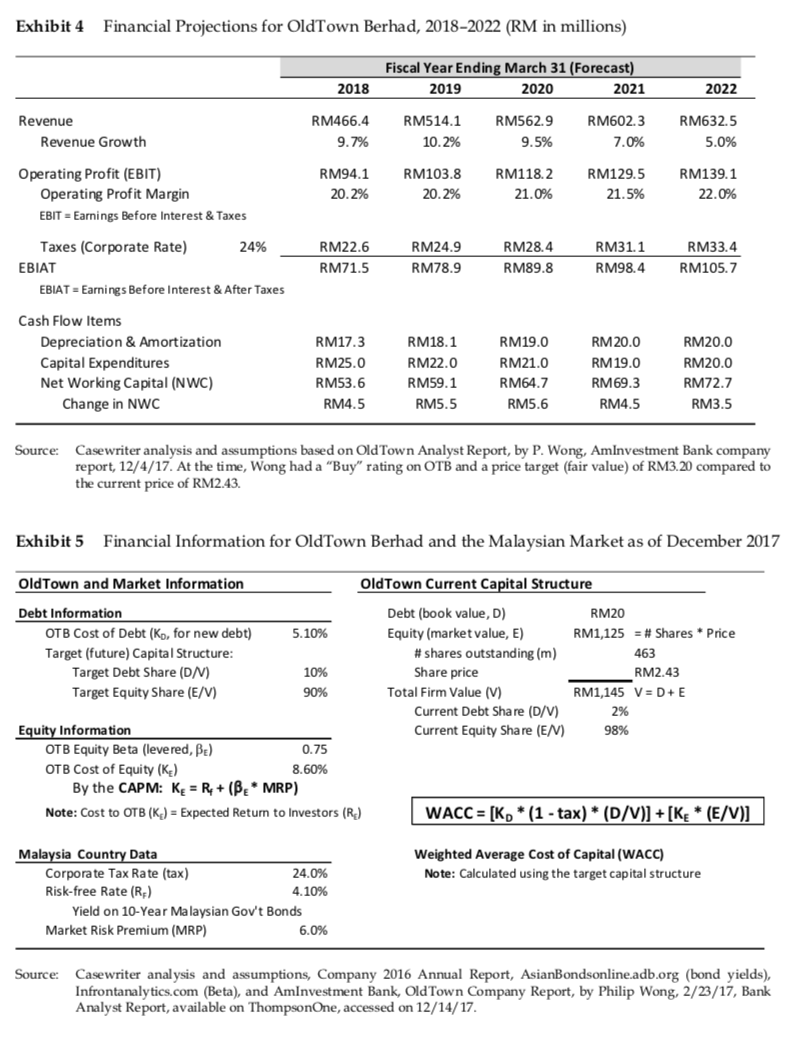
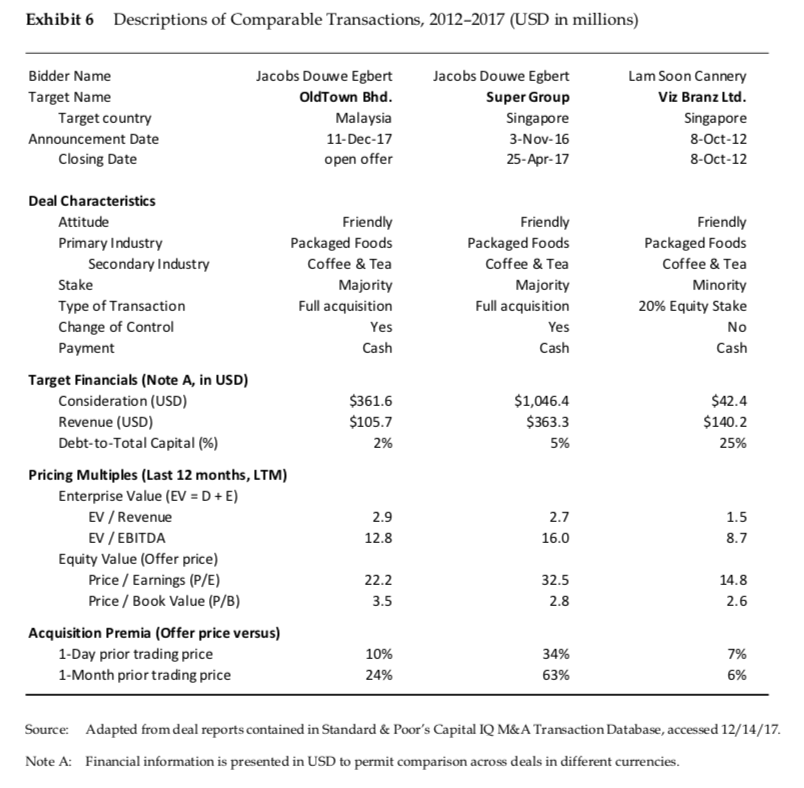
OldTown Berhad On December 11, 2017, Jacobs Douwe Egberts (JDE, the Dutch coffee company) made a conditional offer to acquire OldTown Berhad (OTB, the Malaysian coffee producer and operator of the OldTown White Coffee chain) for RM3.18 per share. At that price, the deal had a total value of RM1.47 billion or US$361 million. While three of the founding shareholders had already agreed to tender (sell) their shares, the remaining shareholders would have to decide whether to tender their shares. JDE indicated it would proceed with a formal offer only after anti-trust authorities in Malaysia and Singapore approved the deal, which most observers believed was likely to happen without a hitch.1 Once they got approval and assuming the remaining shareholders tendered their shares, the acquisition would close in early to mid-2018. OldTown Berhad OTB began operations in 1999 in Ipoh, the capital city of the Malaysian state of Perak. The company invented the "white coffee" category, which referred to the color of its 3-in-1 mixes of cream, sugar, and instant coffee. The company had two divisions: instant beverage manufacturing which was part of the "fast moving consumer goods" (FMCG) category, and food and beverage (F&B). The FMCG division was larger and more profitable (see Table A, below). The F&B division consisted of 234 cafs located across Asia, 197 of which were in Malaysia and 105 of which were Malaysian kopitiam or modern versions of the traditional Malaysian coffeehouse.2 All of OldTown's kitchens, manufacturing facilities, distribution centers, and retail outlets were halal certified (permissible under Islamic law).3 OldTown's FMCG and F&B divisions complemented each other by increasing consumer aware- ness. The cafs allowed customers to try the coffee before buying it in stores, thereby differentiating OldTown from other white coffee suppliers, 5 The company's motto, "Aroma of Good Times," highlighted the association between coffee drinking and fun. As one might expect, OldTown's success attracted competition. In fact, 121 companies, including traditional kopitiam, international chains such as Starbucks, and artisanal outlets such as espressolab and Coffea Coffee, had entered the market recently.7 Increasing competition combined with falling consumer demand caused profits in the F&B division to fall in recent years. A second concern for the company was commodity price risk because both divisions depended on coffee and palm oil as key inputs. Finally, because OTB exported a large fraction of its products and had significant foreign sales, a strengthening Ringgit could put downward pressure on sales and profits. Table A OTB Segment Results in 2017 Percent 2016-2017 of Total Growth Rate Profit Before Tax Percent of Total Profit Margin Segment Revenue F&B FMCG Total RM191.4 RM233.8 RM425.2 45% 55% (1.3%) 17.3% 8.1% RM16.0 RM63.1 RM79.1 20% 80% 8.4% 27.0% 18.6% Source: OldTown Berhad 2017 Annual Report pages 14 and 94. Note: Segment profits omit corporate expenses. As of 2017 (March year-end), OTB had RM425 million in sales and RM60 million of net income (see Exhibit 1). It had total assets of RM455 million and a debt-to-total capitalization ratio of 4% (see Exhibit 2). OTB, a Shariah-compliant stock (i.e., it complied with Islamic law), was traded on the Kuala Lumpur stock exchange. After being flat for several years, its stock price had increased from RM1.50 to RM2.50 in the past two years (see Exhibit 3). In the last two weeks, it had jumped from RM2.51 to RM2.88. The Asian Coffee Market Per capita consumption of coffee in Singapore, Malaysia, Hong Kong, and China was 0.38, 0.11, 0.09, and 0.003 cups per day, respectively.10 Though China's coffee consumption lagged other Asian countries, it had grown by a compound rate of 16% from 2004 to 2014, 11 and analysts believed that OldTown was ready to capitalize on that opportunity. 12 In fact, OTB management believed sales in China would grow 20% to 30% per year in the short-to-medium term. 13 One reason for the optimistic growth projection was the fact that white coffee constituted 54% of the overall coffee market in Hong Kong. The popularity of white coffee made analysts believe that OTB could succeed in the Chinese market, as well. 14 A second reason for the optimism was that instant coffee served as an entry point for new coffee drinkers because it was cheaper and milder than brewed coffee. 15 Within the white coffee market, OldTown was the market leader in Malaysia, Hong Kong, and Singapore, with shares of 48%, 50%, and 35% respectively. 16 Jacobs Douwe Egberts (JDE) Douwe Egberts, a Dutch company, started in 1753 as a grocery store selling coffee, tea, and tobacco.17 JAB Holdings, a German holding company, bought Douwe Egberts in 2013, and then merged it with the coffee division of Mondelz (the global snack and foods company that was formerly part of Kraft Foods) in 2015 to form Jacobs Douwe Egberts (JDE). Following the merger, JDE acquired a series of food and beverage companies. For example, it bought Keurig Green Mountain (coffee) for $14.0B and Krispy Kreme (donuts) for $1.4B in 2016.18 Then in 2017, it bought Panera Bread for $7.5B and Bruegger's Bagels for an undisclosed price. 19 Within the coffee segment, JDE brands included, among others, Maxwell House (coffee grounds), Moccona (instant coffee), and Piazza d'Oro (espresso). In 2016, JDE's global turnover (revenue) was 5.2B and its net income was 82m.20 JDE operated in 120 countries and was the world's second largest coffee company with 15% of the global coffee market, second only to Nestl with 23% of the market.21 Nevertheless, JDE was the market leader in more than two dozen countries. In an attempt to grow its coffee business in Asia, JDE bought Super Group, a Singaporean food and beverage company, for $1.45 billion (US$1.05 billion) in early 2017. Although the Super Group produced more than 150 branded consumer products, its primary business was coffee. JDE paid a price that was 34% above the firm's last closing price. 22 JDE CEO Pierre Laubies said that JDE would "... leverage the rich histories of both companies, combining their complementary geographic footprints, portfolios of iconic brands and innovative technologies to offer more people around the world access to high-quality coffee and allowing the company to capitalize on the significant growth opportunities in a highly attractive market." 23 JDE's Offer for OldTown Berhad JDE offered to acquire all 463.2 million shares of OTB that were outstanding in December 2017 at a price of RM3.18 per share 24 This offer was 10.4% above OTB's last closing price of RM2.88, 19.6% above the 1-month volume weighted average market price (VWAMP) of RM2.73, and 20.3% above the 1-year VWAMP of RM2.64.25 JDE CFO Fabien Simon explained the rationale for the deal: The Old Town team is focused on delivering premium, high-quality products to consumers and we see huge potential in the business. We are excited to work with the OldTown team to rapidly grow the business as part of the broader JDE platform." 26 Euromonitor beverage analyst Matthew Barry further explained: "For a company like JDE, whose sales come primarily from mature markets in Europe, the growing markets of Southeast Asia present a real opportunity." 27 When they announced the deal, JDE said that three of the founding shareholders-OldTown International Sdn Bhd, b OldTown's Managing Director Lee Siew Heng, and Mawer Investment Magement Ltd-who collectively held 51% of the shares, had already agreed to tender their shares. The remaining shareholders would now have to decide whether to tender their shares. If JDE got a majority of the shares (greater than 50%), the deal would proceed, but the non-tendering shareholders would retain their shares. If JDE got more than 90% of the shares, it could force the remaining shareholders to tender their shares and it would then delist OTB's shares. Exhibit 4 provides financial projections for OTB from 2018 to 2022. Exhibit 5 provides financial data on OTB and the Malaysian capital markets as of December 2017. Finally, Exhibit 6 provides pricing multiples for the JDE offer and two other acquisitions of coffee companies. Conclusion With an offer on the table, OTB Managing Director Lee Siew Heng said the acquisition would "... accelerate the creation of more shareholder value" 28 and encouraged shareholders to accept the offer. Similarly, virtually all of the investment analysts that followed OTB were telling their clients to accept the offer. For example, the analyst at Alliance DBS said it was "reasonable and fair"; the analyst at MIDF said it represented "good value for investors"; and the analyst at Hong Leong Investment Bank said it represented an "attractive premium."29 Despite these recommendations, the minority shareholders had to decide for themselves whether the offer was indeed reasonable and whether to accept it or not. Exhibit 1 Old Town Berhad Income Statement 2013-2017 (RM in millions) Year Ending March 31 2016 2015 2017 2014 2013 Revenue Cost of Goods Sold Gross Profit SG&A Other Exp./(Inc.) Operating Profit (EBIT) Net Interest Exp. Other Non. Oper. Inc./(Exp.) Profit Before Tax Income Tax Expense Net Income RM425.2 RM168.8 RM256.4 RM88.9 RM94.7 RM 72.8 RM0.7 RM6.8 RM80.2 RM20.2 RM60.0 RM393.4 RM397.7 RM390.2 RM337.6 RM157.9 RM169.3 RM167.0 RM150.7 RM235.5 RM228.4 RM223.2 RM186.9 RM83.2 RM81.4 RM76.7 RM50.3 RM82.7 RM82.0 RM80.6 RM77.3 RM69.6 RM65.0 RM65.9 RM59.3 RM0.7 RM0.6 RMO.2 RM1.1 (RM1.9) (RM1.3) RM0.4 (RM0.5) RM68.2 RM64.2 RM66.4 RM60.0 RM15.9 RM15.1 RM16.0 RM15.5 RM52.3 RM49.1 RM50.4 RM44.5 8.1% (1.1%) 1.9% 15.6% 15.3% 60.3% 17.1% 14.1% 16.2% 14.0% 25% 104. 0 59.9% 17.7% 13.3% 14.4% 13.9% 23% 9 9.4 57.4% 16.3% 12.3% 14.6% 13.7% 24% 108.3 57.2% 16.9% 12.9% 15.1% 13.7% 24% 329.5 55.4% 17.6% 13.2% 14.5% 12.9% 26% 53.9 Financial Ratios Revenue Growth Margins Gross Margin Operating Margin Net Margin (Return on Sales) Return on Equity (ROE, end of year) Return on Invested Capital (ROIC) Effective Tax Rate Interest Cover (Op. Prof./Net Int. Exp.) Profitability & Cash Flow Capital Expenditures Depreciation & Amortization EBITDA Stock Price & Share Information Weighted Avg. Shares Outstanding Closing Stock Price (Mar. 31) Market Capitalization (billions) Earnings per Share (cents) Dividends per Share (cents) Payout Ratio RM22.3 RM16.9 RM89.7 RM10.6 RM16.7 RM86.3 RM14.2 RM18.7 RM83.7 RM17.4 RM19.4 RM85.3 RM51.1 RM16.4 RM75.7 451. 5 RM2.73 RM1,233 RMO.13 RM0.07 54% 4 48.1 RM1.48 RM663 RM0.12 RM0.06 50% 447.8 RM1.72 RM770 RM0.11 RM0.06 55% 453.4 RM1.79 RM812 RM0.11 RM0.06 55% 428.1 RM1.91 RM818 RM0.10 RM0.06 60% Source: Adapted from Standard & Poor's Capital IQ database, accessed 12/13/17 Exhibit 2 OldTown Berhad Balance Sheet 2013-2017 (RM in millions) Year Ending March 31 2016 2015 2017 2014 2013 RM181.8 RM179.5 RM160.3 RM166.4 RM109.4 RM55.8 RM58.4 RM51.5 RM40.5 RM41.7 RM26.7 RM25.5 RM30.1 RM22.5 RM14.2 RM12.3 RM12.1 RM16.7 RM10.9 RM12.1 RM276.5 RM275.5 RM258.6 RM240.3 RM177.4 RM117.7 RM109.7 RM108.7 RM105.6 RM102.4 RM60.8 RM64.4 RM69.8 RM78.1 RM108.3 RM455.0 RM449.6 RM437.1 RM424.1 RM388.0 Assets Cash & ST Investments Accounts Receivable Inventory Other Current Assets Total Current Assets Net PP&E Other LT Assets Total Assets Liabilities & Equity Accounts Payable Accrued Expenses Short-term (ST) Borrowings Current Portion of LT Debt Other Current Liabilities Total Current Liabilities Long-Term (LT) Debt Other LT Liabilities Total Liabilities Total Equity Total Liabilities & Equity RM18.5 RM14.9 RM6.0 RM2.4 RM26.9 RM68.7 RM8.2 RM6.8 RM83.7 RM371.3 RM455.0 RM21.1 RM15.0 RM6.0 RM3.8 RM22.4 RM68.3 RM12.1 RM7.1 RM87.5 RM362.1 RM449.6 RM25.2 RM17.2 RM19.5 RM17.7 RM12.1 RM9.7 RM6.1 RM6.1 RM4.4 RM3.6 RM3.4 RM3.3 RM24.0 RM23.0 RM13.8 RM76.5 RM61.7 RM50.7 RM15.7 RM20.1 RM25.3 RM8.1 RM8.0 RM5.0 RM100.3 RM89.7 RM81.0 RM336.9 RM334.3 RM307.0 RM437.1 RM424.1 RM388.0 1.2% 2.9% 4.024.03 4.03 3.1% 3.38 9.3% 3.89 N/A 3.50 Financial Ratios Asset Growth Current Ratio Leverage Ratios Fin. Leverage (Assets/Equity) Total Debt Total Capital (Debt+Equity) Debt/Total Capital Total Debt / EBITDA Working Capital Ratios Asset Turnover (Sales/Assets) Inventory Turns (COGS/Inventory) 1.23 RM16.6 RM387.9 4% 0.19 1.24 1.30 1.27 1.26 RM21.9 RM25.4 RM29.6 RM33.0 RM384.0 RM362.3 RM363.9 RM340.0 6% 8% 10% 0.250.300.35 0.44 7% 0.93 0.88 0.91 0.92 6.326.195.627.42 0.87 10.61 Source: Adapted from Standard & Poor's Capital IQ database, accessed 12/13/17 Exhibit 3 Old Town Berhad Stock Price, January 2015 to December 2017 (Malaysian Ringgit) RM4.00 Feb. 22: OTB Reports weak 4Q earnings RM3.50 RM3.00 RM2.50 Feb. 22: OTB Reports strong 3 earnings RM2.00 RM1.50 RM1.00 RM0.50 | RM0.00 Jan-15 Apr-15 Jul-15 Oct-15 Jan-16 Apr-16 Jul-16 Oct-16 Jan-17 Apr-17 Jul-17 Oct-17 -OldTown - Berjaya Food ....KL Market Index Source: Case writer analysis using data from Thompson Reuters Datastream, accessed 12/12/17 Note: Berjaya Food Berhad was a Malaysian food (roasted chicken and sushi) and beverage (coffee) company. Its largest division was the Berjaya Starbucks Coffee Company which had 239 stores in Malaysia and comprised 75% of the company's sales and 144% of its operating profits in 2017 (see the 2017 Annual Report, pp. 11-13). Exhibit 4 Financial Projections for OldTown Berhad, 2018-2022 (RM in millions) Fiscal Year Ending March 31 (Forecast) 2019 2020 2021 2018 2022 Revenue Revenue Growth RM466.4 9.7% RM514.1 10.2% RM562.9 9.5% RM602.3 7.0% RM632.5 5.0% Operating Profit (EBIT) Operating Profit Margin EBIT = Earnings Before Interest & Taxes RM94.1 20.2% RM103.8 20.2% RM118.2 21.0% RM129.5 21.5% RM139.1 22.0% Taxes (Corporate Rate) 24% EBIAT EBIAT = Earnings Before Interest & After Taxes RM22.6 RM71.5 RM24.9 RM78.9 RM28.4 RM89.8 RM31.1 RM98.4 RM33.4 RM105.7 Cash Flow Items Depreciation & Amortization Capital Expenditures Net Working Capital (NWC) Change in NWC RM17.3 RM25.0 RM53.6 RM4.5 RM18.1 RM22.0 RM59.1 RM5.5 RM19.0 RM21.0 RM64.7 RM5.6 RM20.0 RM 19.0 RM69.3 RM4.5 RM20.0 RM20.0 RM72.7 RM3.5 Source: Case writer analysis and assumptions based on Old Town Analyst Report, by P. Wong, AmInvestment Bank company report, 12/4/17. At the time, Wong had a "Buy" rating on OTB and a price target (fair value) of RM3.20 compared to the current price of RM2.43. Exhibit 5 Financial Information for OldTown Berhad and the Malaysian Market as of December 2017 OldTown and Market Information OldTown Current Capital Structure 5.10% Debt Information OTB Cost of Debt (Ko, for new debt) Target (future) Capital Structure: Target Debt Share (DN) Target Equity Share (E/V) 10% 90% Debt (book value, D) Equity (market value, E) #shares outstanding (m) Share price Total Firm Value (V) Current Debt Share (D/V) Current Equity Share (EN) RM20 RM1,125 = # Shares * Price 463 RM2.43 RM1,145 V=D+E 2% 98% Equity Information OTB Equity Beta (levered, Be) 0.75 OTB Cost of Equity (K) 8.60% By the CAPM: Ke = R +(BE* MRP) Note: Cost to OTB (K) = Expected Return to Investors (R) | WACC = [K* (1 - tax) * (D/V)] + [K * (E/V)] Weighted Average Cost of Capital (WACC) Note: Calculated using the target capital structure Malaysia Country Data Corporate Tax Rate (tax) 24.0% Risk-free Rate (R) 4.10% Yield on 10-Year Malaysian Gov't Bonds Market Risk Premium (MRP) 6.0% Source: Casewriter analysis and assumptions, Company 2016 Annual Report, AsianBondsonline.adb.org (bond yields), Infrontanalytics.com (Beta), and AmInvestment Bank, Old Town Company Report, by Philip Wong, 2/23/17, Bank Analyst Report, available on ThompsonOne, accessed on 12/14/17. Exhibit 6 Descriptions of Comparable Transactions, 2012-2017 (USD in millions) Bidder Name Target Name Target country Announcement Date Closing Date Jacobs Douwe Egbert OldTown Bhd. Malaysia 11-Dec-17 open offer Jacobs Douwe Egbert Super Group Singapore 3-Nov-16 25-Apr-17 Lam Soon Cannery Viz Branz Ltd. Singapore 8-Oct-12 8-Oct-12 Deal Characteristics Attitude Primary Industry Secondary Industry Stake Type of Transaction Change of Control Payment Target Financials (Note A, in USD) Consideration (USD) Revenue (USD) Debt-to-Total Capital (%) Friendly Packaged Foods Coffee & Tea Majority Full acquisition Yes Cash Friendly Packaged Foods Coffee & Tea Majority Full acquisition Friendly Packaged Foods Coffee & Tea Minority 20% Equity Stake No Cash Yes Cash $361.6 $105.7 $1,046.4 $363.3 5% $42.4 $140.2 25% 2% Pricing Multiples (Last 12 months, LTM) Enterprise Value (EV =D+E) EV / Revenue EV / EBITDA Equity Value (Offer price) Price / Earnings (P/E) Price / Book Value (P/B) 2.9 12.8 2.7 16.0 1.5 8.7 22.2 14.8 32.5 2.8 3.5 Acquisition Premia (Offer price versus) 1-Day prior trading price 1-Month prior trading price 34% 10% 24% 63% Source: Adapted from deal reports contained in Standard & Poor's Capital IQ M&A Transaction Database, accessed 12/14/17. Note A: Financial information is presented in USD to permit comparison across deals in different currencies. OldTown Berhad On December 11, 2017, Jacobs Douwe Egberts (JDE, the Dutch coffee company) made a conditional offer to acquire OldTown Berhad (OTB, the Malaysian coffee producer and operator of the OldTown White Coffee chain) for RM3.18 per share. At that price, the deal had a total value of RM1.47 billion or US$361 million. While three of the founding shareholders had already agreed to tender (sell) their shares, the remaining shareholders would have to decide whether to tender their shares. JDE indicated it would proceed with a formal offer only after anti-trust authorities in Malaysia and Singapore approved the deal, which most observers believed was likely to happen without a hitch.1 Once they got approval and assuming the remaining shareholders tendered their shares, the acquisition would close in early to mid-2018. OldTown Berhad OTB began operations in 1999 in Ipoh, the capital city of the Malaysian state of Perak. The company invented the "white coffee" category, which referred to the color of its 3-in-1 mixes of cream, sugar, and instant coffee. The company had two divisions: instant beverage manufacturing which was part of the "fast moving consumer goods" (FMCG) category, and food and beverage (F&B). The FMCG division was larger and more profitable (see Table A, below). The F&B division consisted of 234 cafs located across Asia, 197 of which were in Malaysia and 105 of which were Malaysian kopitiam or modern versions of the traditional Malaysian coffeehouse.2 All of OldTown's kitchens, manufacturing facilities, distribution centers, and retail outlets were halal certified (permissible under Islamic law).3 OldTown's FMCG and F&B divisions complemented each other by increasing consumer aware- ness. The cafs allowed customers to try the coffee before buying it in stores, thereby differentiating OldTown from other white coffee suppliers, 5 The company's motto, "Aroma of Good Times," highlighted the association between coffee drinking and fun. As one might expect, OldTown's success attracted competition. In fact, 121 companies, including traditional kopitiam, international chains such as Starbucks, and artisanal outlets such as espressolab and Coffea Coffee, had entered the market recently.7 Increasing competition combined with falling consumer demand caused profits in the F&B division to fall in recent years. A second concern for the company was commodity price risk because both divisions depended on coffee and palm oil as key inputs. Finally, because OTB exported a large fraction of its products and had significant foreign sales, a strengthening Ringgit could put downward pressure on sales and profits. Table A OTB Segment Results in 2017 Percent 2016-2017 of Total Growth Rate Profit Before Tax Percent of Total Profit Margin Segment Revenue F&B FMCG Total RM191.4 RM233.8 RM425.2 45% 55% (1.3%) 17.3% 8.1% RM16.0 RM63.1 RM79.1 20% 80% 8.4% 27.0% 18.6% Source: OldTown Berhad 2017 Annual Report pages 14 and 94. Note: Segment profits omit corporate expenses. As of 2017 (March year-end), OTB had RM425 million in sales and RM60 million of net income (see Exhibit 1). It had total assets of RM455 million and a debt-to-total capitalization ratio of 4% (see Exhibit 2). OTB, a Shariah-compliant stock (i.e., it complied with Islamic law), was traded on the Kuala Lumpur stock exchange. After being flat for several years, its stock price had increased from RM1.50 to RM2.50 in the past two years (see Exhibit 3). In the last two weeks, it had jumped from RM2.51 to RM2.88. The Asian Coffee Market Per capita consumption of coffee in Singapore, Malaysia, Hong Kong, and China was 0.38, 0.11, 0.09, and 0.003 cups per day, respectively.10 Though China's coffee consumption lagged other Asian countries, it had grown by a compound rate of 16% from 2004 to 2014, 11 and analysts believed that OldTown was ready to capitalize on that opportunity. 12 In fact, OTB management believed sales in China would grow 20% to 30% per year in the short-to-medium term. 13 One reason for the optimistic growth projection was the fact that white coffee constituted 54% of the overall coffee market in Hong Kong. The popularity of white coffee made analysts believe that OTB could succeed in the Chinese market, as well. 14 A second reason for the optimism was that instant coffee served as an entry point for new coffee drinkers because it was cheaper and milder than brewed coffee. 15 Within the white coffee market, OldTown was the market leader in Malaysia, Hong Kong, and Singapore, with shares of 48%, 50%, and 35% respectively. 16 Jacobs Douwe Egberts (JDE) Douwe Egberts, a Dutch company, started in 1753 as a grocery store selling coffee, tea, and tobacco.17 JAB Holdings, a German holding company, bought Douwe Egberts in 2013, and then merged it with the coffee division of Mondelz (the global snack and foods company that was formerly part of Kraft Foods) in 2015 to form Jacobs Douwe Egberts (JDE). Following the merger, JDE acquired a series of food and beverage companies. For example, it bought Keurig Green Mountain (coffee) for $14.0B and Krispy Kreme (donuts) for $1.4B in 2016.18 Then in 2017, it bought Panera Bread for $7.5B and Bruegger's Bagels for an undisclosed price. 19 Within the coffee segment, JDE brands included, among others, Maxwell House (coffee grounds), Moccona (instant coffee), and Piazza d'Oro (espresso). In 2016, JDE's global turnover (revenue) was 5.2B and its net income was 82m.20 JDE operated in 120 countries and was the world's second largest coffee company with 15% of the global coffee market, second only to Nestl with 23% of the market.21 Nevertheless, JDE was the market leader in more than two dozen countries. In an attempt to grow its coffee business in Asia, JDE bought Super Group, a Singaporean food and beverage company, for $1.45 billion (US$1.05 billion) in early 2017. Although the Super Group produced more than 150 branded consumer products, its primary business was coffee. JDE paid a price that was 34% above the firm's last closing price. 22 JDE CEO Pierre Laubies said that JDE would "... leverage the rich histories of both companies, combining their complementary geographic footprints, portfolios of iconic brands and innovative technologies to offer more people around the world access to high-quality coffee and allowing the company to capitalize on the significant growth opportunities in a highly attractive market." 23 JDE's Offer for OldTown Berhad JDE offered to acquire all 463.2 million shares of OTB that were outstanding in December 2017 at a price of RM3.18 per share 24 This offer was 10.4% above OTB's last closing price of RM2.88, 19.6% above the 1-month volume weighted average market price (VWAMP) of RM2.73, and 20.3% above the 1-year VWAMP of RM2.64.25 JDE CFO Fabien Simon explained the rationale for the deal: The Old Town team is focused on delivering premium, high-quality products to consumers and we see huge potential in the business. We are excited to work with the OldTown team to rapidly grow the business as part of the broader JDE platform." 26 Euromonitor beverage analyst Matthew Barry further explained: "For a company like JDE, whose sales come primarily from mature markets in Europe, the growing markets of Southeast Asia present a real opportunity." 27 When they announced the deal, JDE said that three of the founding shareholders-OldTown International Sdn Bhd, b OldTown's Managing Director Lee Siew Heng, and Mawer Investment Magement Ltd-who collectively held 51% of the shares, had already agreed to tender their shares. The remaining shareholders would now have to decide whether to tender their shares. If JDE got a majority of the shares (greater than 50%), the deal would proceed, but the non-tendering shareholders would retain their shares. If JDE got more than 90% of the shares, it could force the remaining shareholders to tender their shares and it would then delist OTB's shares. Exhibit 4 provides financial projections for OTB from 2018 to 2022. Exhibit 5 provides financial data on OTB and the Malaysian capital markets as of December 2017. Finally, Exhibit 6 provides pricing multiples for the JDE offer and two other acquisitions of coffee companies. Conclusion With an offer on the table, OTB Managing Director Lee Siew Heng said the acquisition would "... accelerate the creation of more shareholder value" 28 and encouraged shareholders to accept the offer. Similarly, virtually all of the investment analysts that followed OTB were telling their clients to accept the offer. For example, the analyst at Alliance DBS said it was "reasonable and fair"; the analyst at MIDF said it represented "good value for investors"; and the analyst at Hong Leong Investment Bank said it represented an "attractive premium."29 Despite these recommendations, the minority shareholders had to decide for themselves whether the offer was indeed reasonable and whether to accept it or not. Exhibit 1 Old Town Berhad Income Statement 2013-2017 (RM in millions) Year Ending March 31 2016 2015 2017 2014 2013 Revenue Cost of Goods Sold Gross Profit SG&A Other Exp./(Inc.) Operating Profit (EBIT) Net Interest Exp. Other Non. Oper. Inc./(Exp.) Profit Before Tax Income Tax Expense Net Income RM425.2 RM168.8 RM256.4 RM88.9 RM94.7 RM 72.8 RM0.7 RM6.8 RM80.2 RM20.2 RM60.0 RM393.4 RM397.7 RM390.2 RM337.6 RM157.9 RM169.3 RM167.0 RM150.7 RM235.5 RM228.4 RM223.2 RM186.9 RM83.2 RM81.4 RM76.7 RM50.3 RM82.7 RM82.0 RM80.6 RM77.3 RM69.6 RM65.0 RM65.9 RM59.3 RM0.7 RM0.6 RMO.2 RM1.1 (RM1.9) (RM1.3) RM0.4 (RM0.5) RM68.2 RM64.2 RM66.4 RM60.0 RM15.9 RM15.1 RM16.0 RM15.5 RM52.3 RM49.1 RM50.4 RM44.5 8.1% (1.1%) 1.9% 15.6% 15.3% 60.3% 17.1% 14.1% 16.2% 14.0% 25% 104. 0 59.9% 17.7% 13.3% 14.4% 13.9% 23% 9 9.4 57.4% 16.3% 12.3% 14.6% 13.7% 24% 108.3 57.2% 16.9% 12.9% 15.1% 13.7% 24% 329.5 55.4% 17.6% 13.2% 14.5% 12.9% 26% 53.9 Financial Ratios Revenue Growth Margins Gross Margin Operating Margin Net Margin (Return on Sales) Return on Equity (ROE, end of year) Return on Invested Capital (ROIC) Effective Tax Rate Interest Cover (Op. Prof./Net Int. Exp.) Profitability & Cash Flow Capital Expenditures Depreciation & Amortization EBITDA Stock Price & Share Information Weighted Avg. Shares Outstanding Closing Stock Price (Mar. 31) Market Capitalization (billions) Earnings per Share (cents) Dividends per Share (cents) Payout Ratio RM22.3 RM16.9 RM89.7 RM10.6 RM16.7 RM86.3 RM14.2 RM18.7 RM83.7 RM17.4 RM19.4 RM85.3 RM51.1 RM16.4 RM75.7 451. 5 RM2.73 RM1,233 RMO.13 RM0.07 54% 4 48.1 RM1.48 RM663 RM0.12 RM0.06 50% 447.8 RM1.72 RM770 RM0.11 RM0.06 55% 453.4 RM1.79 RM812 RM0.11 RM0.06 55% 428.1 RM1.91 RM818 RM0.10 RM0.06 60% Source: Adapted from Standard & Poor's Capital IQ database, accessed 12/13/17 Exhibit 2 OldTown Berhad Balance Sheet 2013-2017 (RM in millions) Year Ending March 31 2016 2015 2017 2014 2013 RM181.8 RM179.5 RM160.3 RM166.4 RM109.4 RM55.8 RM58.4 RM51.5 RM40.5 RM41.7 RM26.7 RM25.5 RM30.1 RM22.5 RM14.2 RM12.3 RM12.1 RM16.7 RM10.9 RM12.1 RM276.5 RM275.5 RM258.6 RM240.3 RM177.4 RM117.7 RM109.7 RM108.7 RM105.6 RM102.4 RM60.8 RM64.4 RM69.8 RM78.1 RM108.3 RM455.0 RM449.6 RM437.1 RM424.1 RM388.0 Assets Cash & ST Investments Accounts Receivable Inventory Other Current Assets Total Current Assets Net PP&E Other LT Assets Total Assets Liabilities & Equity Accounts Payable Accrued Expenses Short-term (ST) Borrowings Current Portion of LT Debt Other Current Liabilities Total Current Liabilities Long-Term (LT) Debt Other LT Liabilities Total Liabilities Total Equity Total Liabilities & Equity RM18.5 RM14.9 RM6.0 RM2.4 RM26.9 RM68.7 RM8.2 RM6.8 RM83.7 RM371.3 RM455.0 RM21.1 RM15.0 RM6.0 RM3.8 RM22.4 RM68.3 RM12.1 RM7.1 RM87.5 RM362.1 RM449.6 RM25.2 RM17.2 RM19.5 RM17.7 RM12.1 RM9.7 RM6.1 RM6.1 RM4.4 RM3.6 RM3.4 RM3.3 RM24.0 RM23.0 RM13.8 RM76.5 RM61.7 RM50.7 RM15.7 RM20.1 RM25.3 RM8.1 RM8.0 RM5.0 RM100.3 RM89.7 RM81.0 RM336.9 RM334.3 RM307.0 RM437.1 RM424.1 RM388.0 1.2% 2.9% 4.024.03 4.03 3.1% 3.38 9.3% 3.89 N/A 3.50 Financial Ratios Asset Growth Current Ratio Leverage Ratios Fin. Leverage (Assets/Equity) Total Debt Total Capital (Debt+Equity) Debt/Total Capital Total Debt / EBITDA Working Capital Ratios Asset Turnover (Sales/Assets) Inventory Turns (COGS/Inventory) 1.23 RM16.6 RM387.9 4% 0.19 1.24 1.30 1.27 1.26 RM21.9 RM25.4 RM29.6 RM33.0 RM384.0 RM362.3 RM363.9 RM340.0 6% 8% 10% 0.250.300.35 0.44 7% 0.93 0.88 0.91 0.92 6.326.195.627.42 0.87 10.61 Source: Adapted from Standard & Poor's Capital IQ database, accessed 12/13/17 Exhibit 3 Old Town Berhad Stock Price, January 2015 to December 2017 (Malaysian Ringgit) RM4.00 Feb. 22: OTB Reports weak 4Q earnings RM3.50 RM3.00 RM2.50 Feb. 22: OTB Reports strong 3 earnings RM2.00 RM1.50 RM1.00 RM0.50 | RM0.00 Jan-15 Apr-15 Jul-15 Oct-15 Jan-16 Apr-16 Jul-16 Oct-16 Jan-17 Apr-17 Jul-17 Oct-17 -OldTown - Berjaya Food ....KL Market Index Source: Case writer analysis using data from Thompson Reuters Datastream, accessed 12/12/17 Note: Berjaya Food Berhad was a Malaysian food (roasted chicken and sushi) and beverage (coffee) company. Its largest division was the Berjaya Starbucks Coffee Company which had 239 stores in Malaysia and comprised 75% of the company's sales and 144% of its operating profits in 2017 (see the 2017 Annual Report, pp. 11-13). Exhibit 4 Financial Projections for OldTown Berhad, 2018-2022 (RM in millions) Fiscal Year Ending March 31 (Forecast) 2019 2020 2021 2018 2022 Revenue Revenue Growth RM466.4 9.7% RM514.1 10.2% RM562.9 9.5% RM602.3 7.0% RM632.5 5.0% Operating Profit (EBIT) Operating Profit Margin EBIT = Earnings Before Interest & Taxes RM94.1 20.2% RM103.8 20.2% RM118.2 21.0% RM129.5 21.5% RM139.1 22.0% Taxes (Corporate Rate) 24% EBIAT EBIAT = Earnings Before Interest & After Taxes RM22.6 RM71.5 RM24.9 RM78.9 RM28.4 RM89.8 RM31.1 RM98.4 RM33.4 RM105.7 Cash Flow Items Depreciation & Amortization Capital Expenditures Net Working Capital (NWC) Change in NWC RM17.3 RM25.0 RM53.6 RM4.5 RM18.1 RM22.0 RM59.1 RM5.5 RM19.0 RM21.0 RM64.7 RM5.6 RM20.0 RM 19.0 RM69.3 RM4.5 RM20.0 RM20.0 RM72.7 RM3.5 Source: Case writer analysis and assumptions based on Old Town Analyst Report, by P. Wong, AmInvestment Bank company report, 12/4/17. At the time, Wong had a "Buy" rating on OTB and a price target (fair value) of RM3.20 compared to the current price of RM2.43. Exhibit 5 Financial Information for OldTown Berhad and the Malaysian Market as of December 2017 OldTown and Market Information OldTown Current Capital Structure 5.10% Debt Information OTB Cost of Debt (Ko, for new debt) Target (future) Capital Structure: Target Debt Share (DN) Target Equity Share (E/V) 10% 90% Debt (book value, D) Equity (market value, E) #shares outstanding (m) Share price Total Firm Value (V) Current Debt Share (D/V) Current Equity Share (EN) RM20 RM1,125 = # Shares * Price 463 RM2.43 RM1,145 V=D+E 2% 98% Equity Information OTB Equity Beta (levered, Be) 0.75 OTB Cost of Equity (K) 8.60% By the CAPM: Ke = R +(BE* MRP) Note: Cost to OTB (K) = Expected Return to Investors (R) | WACC = [K* (1 - tax) * (D/V)] + [K * (E/V)] Weighted Average Cost of Capital (WACC) Note: Calculated using the target capital structure Malaysia Country Data Corporate Tax Rate (tax) 24.0% Risk-free Rate (R) 4.10% Yield on 10-Year Malaysian Gov't Bonds Market Risk Premium (MRP) 6.0% Source: Casewriter analysis and assumptions, Company 2016 Annual Report, AsianBondsonline.adb.org (bond yields), Infrontanalytics.com (Beta), and AmInvestment Bank, Old Town Company Report, by Philip Wong, 2/23/17, Bank Analyst Report, available on ThompsonOne, accessed on 12/14/17. Exhibit 6 Descriptions of Comparable Transactions, 2012-2017 (USD in millions) Bidder Name Target Name Target country Announcement Date Closing Date Jacobs Douwe Egbert OldTown Bhd. Malaysia 11-Dec-17 open offer Jacobs Douwe Egbert Super Group Singapore 3-Nov-16 25-Apr-17 Lam Soon Cannery Viz Branz Ltd. Singapore 8-Oct-12 8-Oct-12 Deal Characteristics Attitude Primary Industry Secondary Industry Stake Type of Transaction Change of Control Payment Target Financials (Note A, in USD) Consideration (USD) Revenue (USD) Debt-to-Total Capital (%) Friendly Packaged Foods Coffee & Tea Majority Full acquisition Yes Cash Friendly Packaged Foods Coffee & Tea Majority Full acquisition Friendly Packaged Foods Coffee & Tea Minority 20% Equity Stake No Cash Yes Cash $361.6 $105.7 $1,046.4 $363.3 5% $42.4 $140.2 25% 2% Pricing Multiples (Last 12 months, LTM) Enterprise Value (EV =D+E) EV / Revenue EV / EBITDA Equity Value (Offer price) Price / Earnings (P/E) Price / Book Value (P/B) 2.9 12.8 2.7 16.0 1.5 8.7 22.2 14.8 32.5 2.8 3.5 Acquisition Premia (Offer price versus) 1-Day prior trading price 1-Month prior trading price 34% 10% 24% 63% Source: Adapted from deal reports contained in Standard & Poor's Capital IQ M&A Transaction Database, accessed 12/14/17. Note A: Financial information is presented in USD to permit comparison across deals in different currencies